
 Yahoo Finance
 Investors three-year losses continue as ChampionX (NASDAQ:CHX) dips a further 4.9% this week, earnings continue to decline
In order to justify the effort of selecting individual stocks, it's worth striving to beat the returns from a market index fund. But in any portfolio, there are likely to be some stocks that fall short of that benchmark. Unfortunately, that's been the case for longer term ChampionX Corporation (NASDAQ:CHX) shareholders, since the share price is down 26% in the last three years, falling well short of the market return of around 37%. The falls have accelerated recently, with the share price down 14% in the last three months. However, one could argue that the price has been influenced by the general market, which is down 5.8% in the same timeframe.
Since ChampionX has shed US$225m from its value in the past 7 days, let's see if the longer term decline has been driven by the business' economics.
Check out our latest analysis for ChampionX
To paraphrase Benjamin Graham: Over the short term the market is a voting machine, but over the long term it's a weighing machine. One imperfect but simple way to consider how the market perception of a company has shifted is to compare the change in the earnings per share (EPS) with the share price movement.
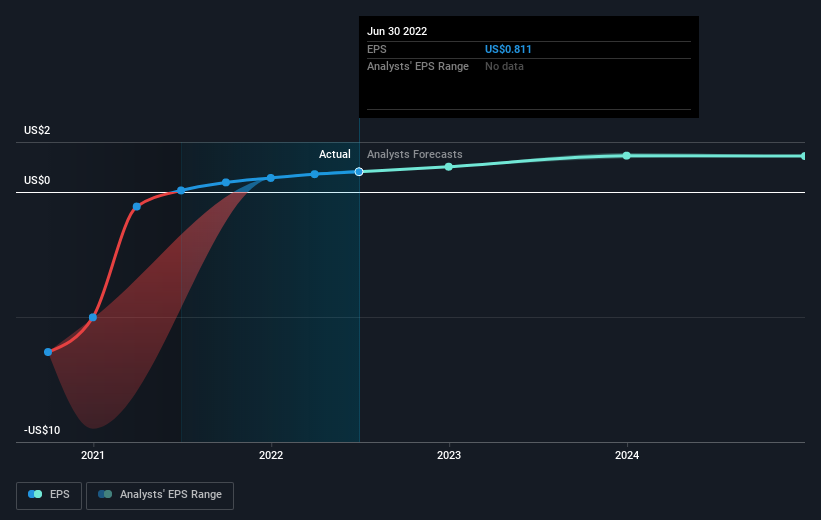
ChampionX saw its EPS decline at a compound rate of 11% per year, over the last three years. This fall in EPS isn't far from the rate of share price decline, which was 10% per year. So it seems that investor expectations of the company are staying pretty steady, despite the disappointment. Rather, the share price has approximately tracked EPS growth.
You can see below how EPS has changed over time (discover the exact values by clicking on the image).
We know that ChampionX has improved its bottom line lately, but is it going to grow revenue? Check if analysts think ChampionX will grow revenue in the future.
A Different Perspective
ChampionX shareholders may not have made money over the last year, but their total loss of 5.6% ( including dividends) isn't as bad as the market loss of around 5.6%. The one-year return is also not as bad as the 8% per annum loss investors have suffered over the last three years. It is of course not much comfort to know that the losses have slowed. Shareholders will be hoping for a proper turnaround, no doubt. Before deciding if you like the current share price, check how ChampionX scores on these 3 valuation metrics.
If you like to buy stocks alongside management, then you might just love this free list of companies. (Hint: insiders have been buying them).
Please note, the market returns quoted in this article reflect the market weighted average returns of stocks that currently trade on US exchanges.
Have feedback on this article? Concerned about the content? Get in touch with us directly. Alternatively, email editorial-team (at) simplywallst.com.
This article by Simply Wall St is general in nature. We provide commentary based on historical data and analyst forecasts only using an unbiased methodology and our articles are not intended to be financial advice. It does not constitute a recommendation to buy or sell any stock, and does not take account of your objectives, or your financial situation. We aim to bring you long-term focused analysis driven by fundamental data. Note that our analysis may not factor in the latest price-sensitive company announcements or qualitative material. Simply Wall St has no position in any stocks mentioned.
Join A Paid User Research Session
You’ll receive a US$30 Amazon Gift card for 1 hour of your time while helping us build better investing tools for the individual investors like yourself. Sign up here
