
 Yahoo Finance
 Investors three-year losses continue as Rolls-Royce Holdings (LON:RR.) dips a further 5.7% this week, earnings continue to decline
While it may not be enough for some shareholders, we think it is good to see the Rolls-Royce Holdings plc (LON:RR.) share price up 15% in a single quarter. But that doesn't change the fact that the returns over the last three years have been disappointing. Tragically, the share price declined 84% in that time. So it's good to see it climbing back up. After all, could be that the fall was overdone. We really hope anyone holding through that price crash has a diversified portfolio. Even when you lose money, you don't have to lose the lesson.
Since Rolls-Royce Holdings has shed UK£682m from its value in the past 7 days, let's see if the longer term decline has been driven by the business' economics.
See our latest analysis for Rolls-Royce Holdings
In his essay The Superinvestors of Graham-and-Doddsville Warren Buffett described how share prices do not always rationally reflect the value of a business. One flawed but reasonable way to assess how sentiment around a company has changed is to compare the earnings per share (EPS) with the share price.
During five years of share price growth, Rolls-Royce Holdings moved from a loss to profitability. That would generally be considered a positive, so we are surprised to see the share price is down. So given the share price is down it's worth checking some other metrics too.
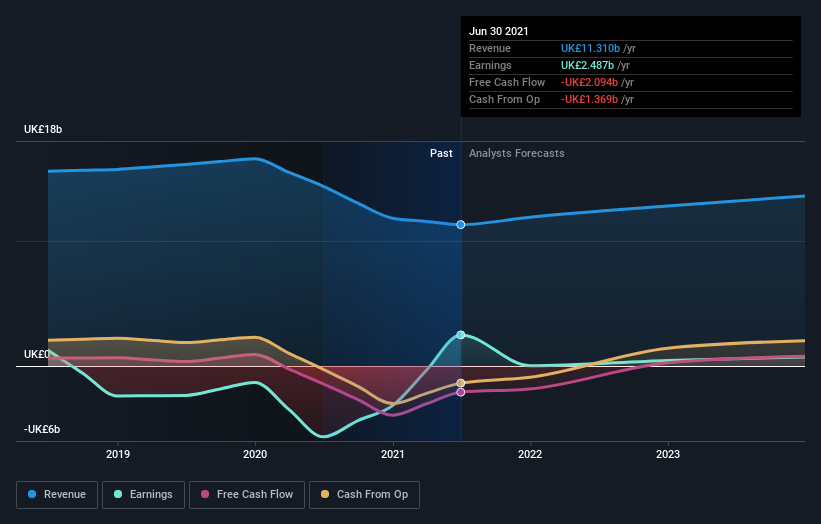
We think that the revenue decline over three years, at a rate of 11% per year, probably had some shareholders looking to sell. After all, if revenue keeps shrinking, it may be difficult to find earnings growth in the future.
The graphic below depicts how earnings and revenue have changed over time (unveil the exact values by clicking on the image).
It's good to see that there was some significant insider buying in the last three months. That's a positive. That said, we think earnings and revenue growth trends are even more important factors to consider. So we recommend checking out this free report showing consensus forecasts
What about the Total Shareholder Return (TSR)?
We'd be remiss not to mention the difference between Rolls-Royce Holdings' total shareholder return (TSR) and its share price return. Arguably the TSR is a more complete return calculation because it accounts for the value of dividends (as if they were reinvested), along with the hypothetical value of any discounted capital that have been offered to shareholders. Dividends have been really beneficial for Rolls-Royce Holdings shareholders, and that cash payout explains why its total shareholder loss of 52%, over the last 3 years, isn't as bad as the share price return.
A Different Perspective
It's nice to see that Rolls-Royce Holdings shareholders have received a total shareholder return of 27% over the last year. Notably the five-year annualised TSR loss of 7% per year compares very unfavourably with the recent share price performance. The long term loss makes us cautious, but the short term TSR gain certainly hints at a brighter future. It's always interesting to track share price performance over the longer term. But to understand Rolls-Royce Holdings better, we need to consider many other factors. For instance, we've identified 3 warning signs for Rolls-Royce Holdings (2 make us uncomfortable) that you should be aware of.
If you like to buy stocks alongside management, then you might just love this free list of companies. (Hint: insiders have been buying them).
Please note, the market returns quoted in this article reflect the market weighted average returns of stocks that currently trade on GB exchanges.
This article by Simply Wall St is general in nature. We provide commentary based on historical data and analyst forecasts only using an unbiased methodology and our articles are not intended to be financial advice. It does not constitute a recommendation to buy or sell any stock, and does not take account of your objectives, or your financial situation. We aim to bring you long-term focused analysis driven by fundamental data. Note that our analysis may not factor in the latest price-sensitive company announcements or qualitative material. Simply Wall St has no position in any stocks mentioned.
Have feedback on this article? Concerned about the content? Get in touch with us directly. Alternatively, email editorial-team (at) simplywallst.com.
