Investors three-year losses grow to 73% as the stock sheds UK£52m this past week
As every investor would know, not every swing hits the sweet spot. But really big losses can really drag down an overall portfolio. So consider, for a moment, the misfortune of SIG plc (LON:SHI) investors who have held the stock for three years as it declined a whopping 74%. That'd be enough to cause even the strongest minds some disquiet. And the ride hasn't got any smoother in recent times over the last year, with the price 31% lower in that time. And the share price decline continued over the last week, dropping some 11%. But this could be related to the soft market, which is down about 4.6% in the same period.
Given the past week has been tough on shareholders, let's investigate the fundamentals and see what we can learn.
View our latest analysis for SIG
SIG isn't currently profitable, so most analysts would look to revenue growth to get an idea of how fast the underlying business is growing. Shareholders of unprofitable companies usually expect strong revenue growth. As you can imagine, fast revenue growth, when maintained, often leads to fast profit growth.
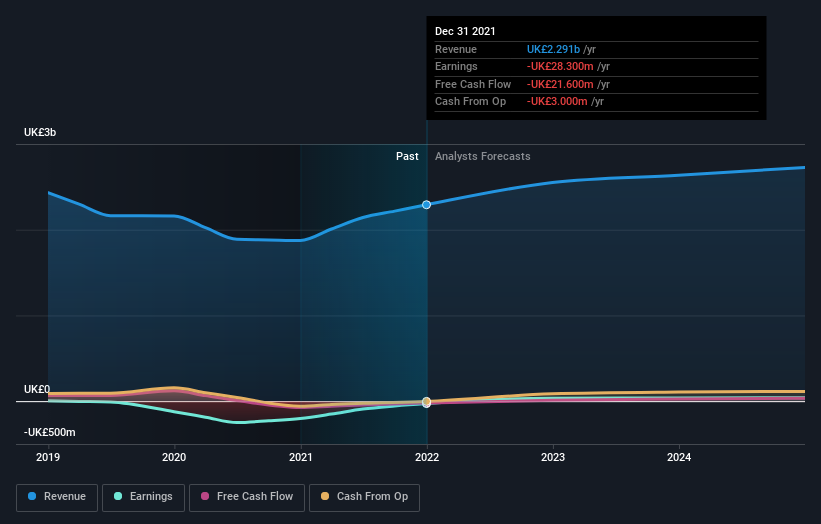
Over the last three years, SIG's revenue dropped 2.6% per year. That is not a good result. Having said that the 20% annualized share price decline highlights the risk of investing in unprofitable companies. We're generally averse to companies with declining revenues, but we're not alone in that. There's no more than a snowball's chance in hell that share price will head back to its old highs, in the short term.
You can see below how earnings and revenue have changed over time (discover the exact values by clicking on the image).
We consider it positive that insiders have made significant purchases in the last year. Even so, future earnings will be far more important to whether current shareholders make money. So we recommend checking out this free report showing consensus forecasts
A Different Perspective
We regret to report that SIG shareholders are down 31% for the year. Unfortunately, that's worse than the broader market decline of 1.3%. However, it could simply be that the share price has been impacted by broader market jitters. It might be worth keeping an eye on the fundamentals, in case there's a good opportunity. Regrettably, last year's performance caps off a bad run, with the shareholders facing a total loss of 11% per year over five years. Generally speaking long term share price weakness can be a bad sign, though contrarian investors might want to research the stock in hope of a turnaround. It is all well and good that insiders have been buying shares, but we suggest you check here to see what price insiders were buying at.
If you like to buy stocks alongside management, then you might just love this free list of companies. (Hint: insiders have been buying them).
Please note, the market returns quoted in this article reflect the market weighted average returns of stocks that currently trade on GB exchanges.
Have feedback on this article? Concerned about the content? Get in touch with us directly. Alternatively, email editorial-team (at) simplywallst.com.
This article by Simply Wall St is general in nature. We provide commentary based on historical data and analyst forecasts only using an unbiased methodology and our articles are not intended to be financial advice. It does not constitute a recommendation to buy or sell any stock, and does not take account of your objectives, or your financial situation. We aim to bring you long-term focused analysis driven by fundamental data. Note that our analysis may not factor in the latest price-sensitive company announcements or qualitative material. Simply Wall St has no position in any stocks mentioned.

 Yahoo Finance
