
 Yahoo Finance
 Investors in Thungela Resources (JSE:TGA) have seen returns of 6.1% over the past year
It's normal to be annoyed when stock you own has a declining share price. But often it is not a reflection of the fundamental business performance. So while the Thungela Resources Limited (JSE:TGA) share price is down 33% in the last year, the total return to shareholders (which includes dividends) was 6.1%. That's better than the market which declined 1.0% over the last year. Thungela Resources hasn't been listed for long, so although we're wary of recent listings that perform poorly, it may still prove itself with time. Shareholders have had an even rougher run lately, with the share price down 27% in the last 90 days.
Now let's have a look at the company's fundamentals, and see if the long term shareholder return has matched the performance of the underlying business.
View our latest analysis for Thungela Resources
While markets are a powerful pricing mechanism, share prices reflect investor sentiment, not just underlying business performance. One imperfect but simple way to consider how the market perception of a company has shifted is to compare the change in the earnings per share (EPS) with the share price movement.
Even though the Thungela Resources share price is down over the year, its EPS actually improved. Of course, the situation might betray previous over-optimism about growth.
It's fair to say that the share price does not seem to be reflecting the EPS growth. So it's easy to justify a look at some other metrics.
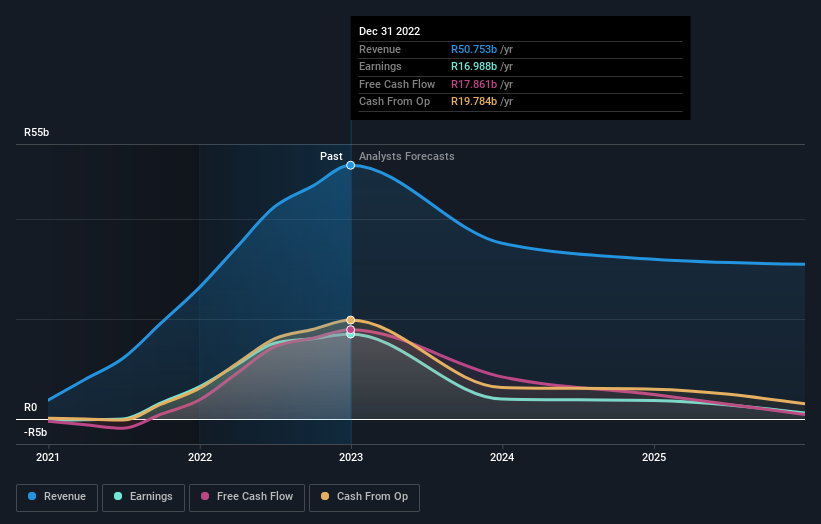
Thungela Resources' dividend seems healthy to us, so we doubt that the yield is a concern for the market. The revenue trend doesn't seem to explain why the share price is down. Of course, it could simply be that it simply fell short of the market consensus expectations.
You can see below how earnings and revenue have changed over time (discover the exact values by clicking on the image).
We know that Thungela Resources has improved its bottom line lately, but what does the future have in store? If you are thinking of buying or selling Thungela Resources stock, you should check out this free report showing analyst profit forecasts.
What About Dividends?
It is important to consider the total shareholder return, as well as the share price return, for any given stock. Whereas the share price return only reflects the change in the share price, the TSR includes the value of dividends (assuming they were reinvested) and the benefit of any discounted capital raising or spin-off. So for companies that pay a generous dividend, the TSR is often a lot higher than the share price return. As it happens, Thungela Resources' TSR for the last 1 year was 6.1%, which exceeds the share price return mentioned earlier. The dividends paid by the company have thusly boosted the total shareholder return.
A Different Perspective
It's nice to see that Thungela Resources shareholders have gained 6.1% over the last year, including dividends. We regret to report that the share price is down 27% over ninety days. Shorter term share price moves often don't signify much about the business itself. While it is well worth considering the different impacts that market conditions can have on the share price, there are other factors that are even more important. Case in point: We've spotted 4 warning signs for Thungela Resources you should be aware of, and 1 of them doesn't sit too well with us.
If you would prefer to check out another company -- one with potentially superior financials -- then do not miss this free list of companies that have proven they can grow earnings.
Please note, the market returns quoted in this article reflect the market weighted average returns of stocks that currently trade on South African exchanges.
Have feedback on this article? Concerned about the content? Get in touch with us directly. Alternatively, email editorial-team (at) simplywallst.com.
This article by Simply Wall St is general in nature. We provide commentary based on historical data and analyst forecasts only using an unbiased methodology and our articles are not intended to be financial advice. It does not constitute a recommendation to buy or sell any stock, and does not take account of your objectives, or your financial situation. We aim to bring you long-term focused analysis driven by fundamental data. Note that our analysis may not factor in the latest price-sensitive company announcements or qualitative material. Simply Wall St has no position in any stocks mentioned.
Join A Paid User Research Session
You’ll receive a US$30 Amazon Gift card for 1 hour of your time while helping us build better investing tools for the individual investors like yourself. Sign up here
