
 Yahoo Finance
 Investors in Tribal Group (LON:TRB) have made a decent return of 35% over the past five years
When we invest, we're generally looking for stocks that outperform the market average. And while active stock picking involves risks (and requires diversification) it can also provide excess returns. For example, long term Tribal Group plc (LON:TRB) shareholders have enjoyed a 25% share price rise over the last half decade, well in excess of the market decline of around 8.3% (not including dividends).
Let's take a look at the underlying fundamentals over the longer term, and see if they've been consistent with shareholders returns.
View our latest analysis for Tribal Group
While the efficient markets hypothesis continues to be taught by some, it has been proven that markets are over-reactive dynamic systems, and investors are not always rational. One way to examine how market sentiment has changed over time is to look at the interaction between a company's share price and its earnings per share (EPS).
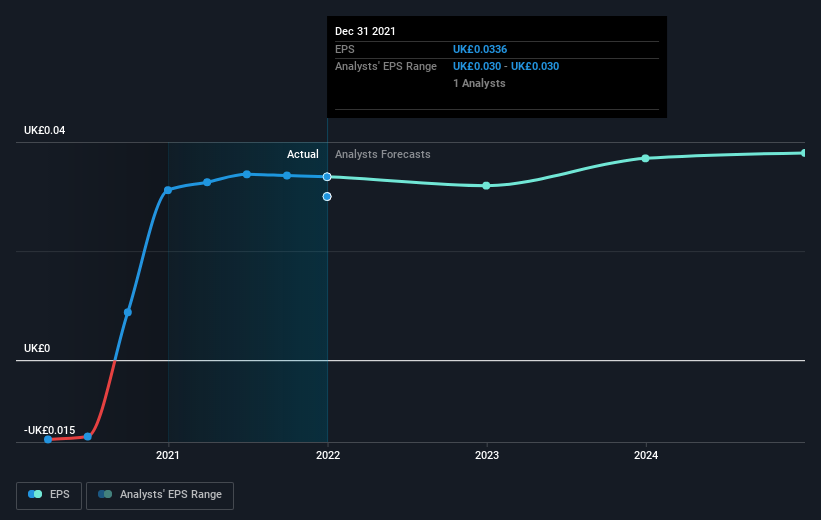
During the five years of share price growth, Tribal Group moved from a loss to profitability. That would generally be considered a positive, so we'd expect the share price to be up. Since the company was unprofitable five years ago, but not three years ago, it's worth taking a look at the returns in the last three years, too. Indeed, the Tribal Group share price has gained 22% in three years. Meanwhile, EPS is up 16% per year. This EPS growth is higher than the 7% average annual increase in the share price over the same three years. So you might conclude the market is a little more cautious about the stock, these days.
The company's earnings per share (over time) is depicted in the image below (click to see the exact numbers).
Before buying or selling a stock, we always recommend a close examination of historic growth trends, available here.
What About Dividends?
As well as measuring the share price return, investors should also consider the total shareholder return (TSR). The TSR is a return calculation that accounts for the value of cash dividends (assuming that any dividend received was reinvested) and the calculated value of any discounted capital raisings and spin-offs. It's fair to say that the TSR gives a more complete picture for stocks that pay a dividend. We note that for Tribal Group the TSR over the last 5 years was 35%, which is better than the share price return mentioned above. The dividends paid by the company have thusly boosted the total shareholder return.
A Different Perspective
We regret to report that Tribal Group shareholders are down 9.6% for the year (even including dividends). Unfortunately, that's worse than the broader market decline of 4.8%. However, it could simply be that the share price has been impacted by broader market jitters. It might be worth keeping an eye on the fundamentals, in case there's a good opportunity. On the bright side, long term shareholders have made money, with a gain of 6% per year over half a decade. It could be that the recent sell-off is an opportunity, so it may be worth checking the fundamental data for signs of a long term growth trend. Before deciding if you like the current share price, check how Tribal Group scores on these 3 valuation metrics.
Of course Tribal Group may not be the best stock to buy. So you may wish to see this free collection of growth stocks.
Please note, the market returns quoted in this article reflect the market weighted average returns of stocks that currently trade on GB exchanges.
Have feedback on this article? Concerned about the content? Get in touch with us directly. Alternatively, email editorial-team (at) simplywallst.com.
This article by Simply Wall St is general in nature. We provide commentary based on historical data and analyst forecasts only using an unbiased methodology and our articles are not intended to be financial advice. It does not constitute a recommendation to buy or sell any stock, and does not take account of your objectives, or your financial situation. We aim to bring you long-term focused analysis driven by fundamental data. Note that our analysis may not factor in the latest price-sensitive company announcements or qualitative material. Simply Wall St has no position in any stocks mentioned.
Join A Paid User Research Session
You’ll receive a US$30 Amazon Gift card for 1 hour of your time while helping us build better investing tools for the individual investors like yourself. Sign up here
