
 Yahoo Finance
 Investors in Tribal Group (LON:TRB) have unfortunately lost 55% over the last year
The nature of investing is that you win some, and you lose some. And there's no doubt that Tribal Group plc (LON:TRB) stock has had a really bad year. To wit the share price is down 56% in that time. At least the damage isn't so bad if you look at the last three years, since the stock is down 25% in that time. Shareholders have had an even rougher run lately, with the share price down 36% in the last 90 days.
With that in mind, it's worth seeing if the company's underlying fundamentals have been the driver of long term performance, or if there are some discrepancies.
Check out our latest analysis for Tribal Group
While markets are a powerful pricing mechanism, share prices reflect investor sentiment, not just underlying business performance. One flawed but reasonable way to assess how sentiment around a company has changed is to compare the earnings per share (EPS) with the share price.
Unfortunately Tribal Group reported an EPS drop of 42% for the last year. The share price decline of 56% is actually more than the EPS drop. Unsurprisingly, given the lack of EPS growth, the market seems to be more cautious about the stock.
The image below shows how EPS has tracked over time (if you click on the image you can see greater detail).
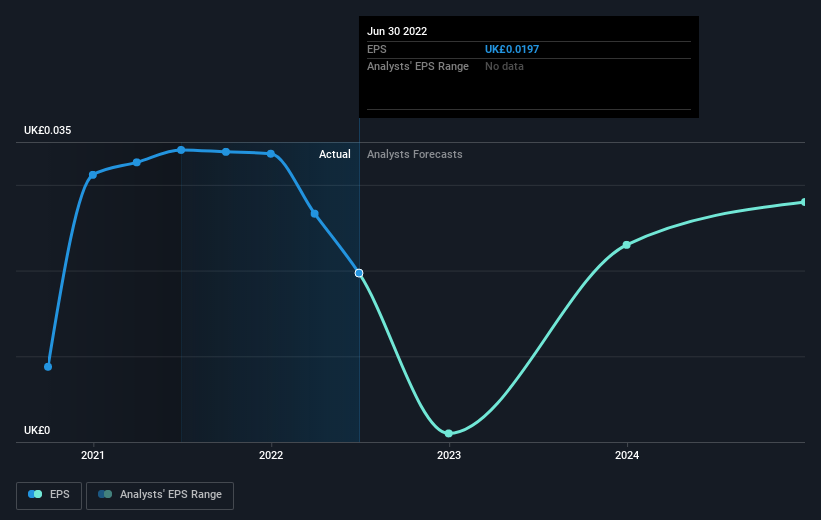
This free interactive report on Tribal Group's earnings, revenue and cash flow is a great place to start, if you want to investigate the stock further.
A Different Perspective
We regret to report that Tribal Group shareholders are down 55% for the year (even including dividends). Unfortunately, that's worse than the broader market decline of 5.6%. Having said that, it's inevitable that some stocks will be oversold in a falling market. The key is to keep your eyes on the fundamental developments. Regrettably, last year's performance caps off a bad run, with the shareholders facing a total loss of 7% per year over five years. Generally speaking long term share price weakness can be a bad sign, though contrarian investors might want to research the stock in hope of a turnaround. While it is well worth considering the different impacts that market conditions can have on the share price, there are other factors that are even more important. Consider risks, for instance. Every company has them, and we've spotted 3 warning signs for Tribal Group you should know about.
Of course Tribal Group may not be the best stock to buy. So you may wish to see this free collection of growth stocks.
Please note, the market returns quoted in this article reflect the market weighted average returns of stocks that currently trade on GB exchanges.
Have feedback on this article? Concerned about the content? Get in touch with us directly. Alternatively, email editorial-team (at) simplywallst.com.
This article by Simply Wall St is general in nature. We provide commentary based on historical data and analyst forecasts only using an unbiased methodology and our articles are not intended to be financial advice. It does not constitute a recommendation to buy or sell any stock, and does not take account of your objectives, or your financial situation. We aim to bring you long-term focused analysis driven by fundamental data. Note that our analysis may not factor in the latest price-sensitive company announcements or qualitative material. Simply Wall St has no position in any stocks mentioned.
Join A Paid User Research Session
You’ll receive a US$30 Amazon Gift card for 1 hour of your time while helping us build better investing tools for the individual investors like yourself. Sign up here
