
 Yahoo Finance
 Are Investors Undervaluing Alphawave IP Group plc (LON:AWE) By 31%?
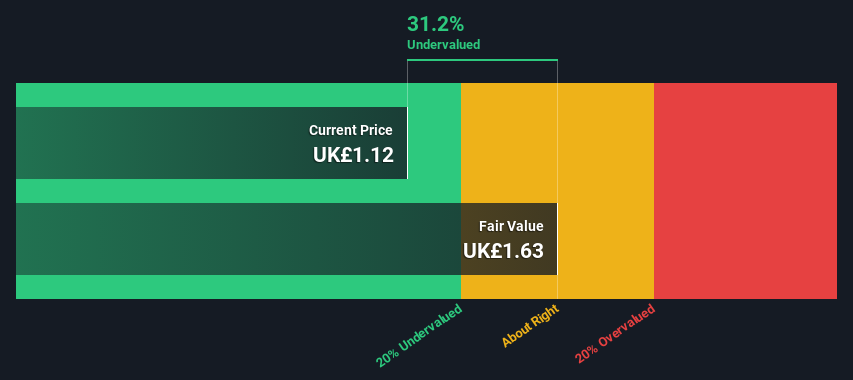
Key Insights
The projected fair value for Alphawave IP Group is UK£1.63 based on 2 Stage Free Cash Flow to Equity
Current share price of UK£1.12 suggests Alphawave IP Group is potentially 31% undervalued
Our fair value estimate is 17% lower than Alphawave IP Group's analyst price target of US$1.97
Does the December share price for Alphawave IP Group plc (LON:AWE) reflect what it's really worth? Today, we will estimate the stock's intrinsic value by taking the expected future cash flows and discounting them to today's value. Our analysis will employ the Discounted Cash Flow (DCF) model. Before you think you won't be able to understand it, just read on! It's actually much less complex than you'd imagine.
We would caution that there are many ways of valuing a company and, like the DCF, each technique has advantages and disadvantages in certain scenarios. If you want to learn more about discounted cash flow, the rationale behind this calculation can be read in detail in the Simply Wall St analysis model.
Check out our latest analysis for Alphawave IP Group
What's The Estimated Valuation?
We are going to use a two-stage DCF model, which, as the name states, takes into account two stages of growth. The first stage is generally a higher growth period which levels off heading towards the terminal value, captured in the second 'steady growth' period. To begin with, we have to get estimates of the next ten years of cash flows. Where possible we use analyst estimates, but when these aren't available we extrapolate the previous free cash flow (FCF) from the last estimate or reported value. We assume companies with shrinking free cash flow will slow their rate of shrinkage, and that companies with growing free cash flow will see their growth rate slow, over this period. We do this to reflect that growth tends to slow more in the early years than it does in later years.
Generally we assume that a dollar today is more valuable than a dollar in the future, so we need to discount the sum of these future cash flows to arrive at a present value estimate:
10-year free cash flow (FCF) estimate
2024 | 2025 | 2026 | 2027 | 2028 | 2029 | 2030 | 2031 | 2032 | 2033 | |
Levered FCF ($, Millions) | US$75.5m | US$94.4m | US$108.4m | US$120.1m | US$129.7m | US$137.6m | US$144.1m | US$149.5m | US$154.1m | US$158.1m |
Growth Rate Estimate Source | Analyst x2 | Analyst x1 | Est @ 14.79% | Est @ 10.81% | Est @ 8.02% | Est @ 6.07% | Est @ 4.71% | Est @ 3.75% | Est @ 3.08% | Est @ 2.61% |
Present Value ($, Millions) Discounted @ 10% | US$68.6 | US$78.0 | US$81.3 | US$81.9 | US$80.4 | US$77.5 | US$73.7 | US$69.5 | US$65.1 | US$60.7 |
("Est" = FCF growth rate estimated by Simply Wall St)
Present Value of 10-year Cash Flow (PVCF) = US$737m
After calculating the present value of future cash flows in the initial 10-year period, we need to calculate the Terminal Value, which accounts for all future cash flows beyond the first stage. For a number of reasons a very conservative growth rate is used that cannot exceed that of a country's GDP growth. In this case we have used the 5-year average of the 10-year government bond yield (1.5%) to estimate future growth. In the same way as with the 10-year 'growth' period, we discount future cash flows to today's value, using a cost of equity of 10%.
Terminal Value (TV)= FCF2033 × (1 + g) ÷ (r – g) = US$158m× (1 + 1.5%) ÷ (10%– 1.5%) = US$1.9b
Present Value of Terminal Value (PVTV)= TV / (1 + r)10= US$1.9b÷ ( 1 + 10%)10= US$724m
The total value, or equity value, is then the sum of the present value of the future cash flows, which in this case is US$1.5b. The last step is to then divide the equity value by the number of shares outstanding. Relative to the current share price of UK£1.1, the company appears quite good value at a 31% discount to where the stock price trades currently. Remember though, that this is just an approximate valuation, and like any complex formula - garbage in, garbage out.
Important Assumptions
The calculation above is very dependent on two assumptions. The first is the discount rate and the other is the cash flows. Part of investing is coming up with your own evaluation of a company's future performance, so try the calculation yourself and check your own assumptions. The DCF also does not consider the possible cyclicality of an industry, or a company's future capital requirements, so it does not give a full picture of a company's potential performance. Given that we are looking at Alphawave IP Group as potential shareholders, the cost of equity is used as the discount rate, rather than the cost of capital (or weighted average cost of capital, WACC) which accounts for debt. In this calculation we've used 10%, which is based on a levered beta of 1.442. Beta is a measure of a stock's volatility, compared to the market as a whole. We get our beta from the industry average beta of globally comparable companies, with an imposed limit between 0.8 and 2.0, which is a reasonable range for a stable business.
SWOT Analysis for Alphawave IP Group
Strength
Debt is well covered by earnings.
Weakness
Shareholders have been diluted in the past year.
Opportunity
Expected to breakeven next year.
Has sufficient cash runway for more than 3 years based on current free cash flows.
Good value based on P/S ratio and estimated fair value.
Threat
Debt is not well covered by operating cash flow.
Looking Ahead:
Valuation is only one side of the coin in terms of building your investment thesis, and it shouldn't be the only metric you look at when researching a company. DCF models are not the be-all and end-all of investment valuation. Instead the best use for a DCF model is to test certain assumptions and theories to see if they would lead to the company being undervalued or overvalued. For instance, if the terminal value growth rate is adjusted slightly, it can dramatically alter the overall result. Why is the intrinsic value higher than the current share price? For Alphawave IP Group, we've put together three important items you should look at:
Risks: To that end, you should be aware of the 1 warning sign we've spotted with Alphawave IP Group .
Future Earnings: How does AWE's growth rate compare to its peers and the wider market? Dig deeper into the analyst consensus number for the upcoming years by interacting with our free analyst growth expectation chart.
Other High Quality Alternatives: Do you like a good all-rounder? Explore our interactive list of high quality stocks to get an idea of what else is out there you may be missing!
PS. The Simply Wall St app conducts a discounted cash flow valuation for every stock on the LSE every day. If you want to find the calculation for other stocks just search here.
Have feedback on this article? Concerned about the content? Get in touch with us directly. Alternatively, email editorial-team (at) simplywallst.com.
This article by Simply Wall St is general in nature. We provide commentary based on historical data and analyst forecasts only using an unbiased methodology and our articles are not intended to be financial advice. It does not constitute a recommendation to buy or sell any stock, and does not take account of your objectives, or your financial situation. We aim to bring you long-term focused analysis driven by fundamental data. Note that our analysis may not factor in the latest price-sensitive company announcements or qualitative material. Simply Wall St has no position in any stocks mentioned.
