
 Yahoo Finance
 Investors Are Undervaluing Man Group plc (LON:EMG) By 7.91%

EMG operates in the capital markets sector, which has characteristics that make it unique to other industries. Understanding these differences is crucial when it comes to putting a value on the financial stock. Maintaining a certain level of cash capital ratio is common for these financial firms to abide by, in order to minimize risks to their shareholders. Focusing on data points such as book values, on top of the return and cost of equity, may be suitable for gauging EMG’s valuation. Today I’ll determine how to value EMG in a fairly accurate and uncomplicated way. Check out our latest analysis for Man Group
What Is The Excess Return Model?
There are two facets to consider: regulation and type of assets. Financial firms operating in United Kingdom face strict financial regulation. In addition to this, capital markets tend to not possess substantial portions of tangible assets on their books. So the Excess Returns model is suitable for determining the intrinsic value of EMG rather than the traditional discounted cash flow model, which places emphasis on factors such as depreciation and capex.
Deriving EMG’s Intrinsic Value
The central assumption for this model is, the value of the company is how much money it can generate from its current level of equity capital, in excess of the cost of that capital. The returns above the cost of equity is known as excess returns:
Excess Return Per Share = (Stable Return On Equity – Cost Of Equity) (Book Value Of Equity Per Share)
= (19.87% – 9.26%) x $1.12 = $0.12
We use this value to calculate the terminal value of the company, which is how much we expect the company to continue to earn every year, forever. This is a common component of discounted cash flow models:
Terminal Value Per Share = Excess Return Per Share / (Cost of Equity – Expected Growth Rate)
= $0.12 / (9.26% – 1.40%) = $1.51
Putting this all together, we get the value of EMG’s share:
Value Per Share = Book Value of Equity Per Share + Terminal Value Per Share
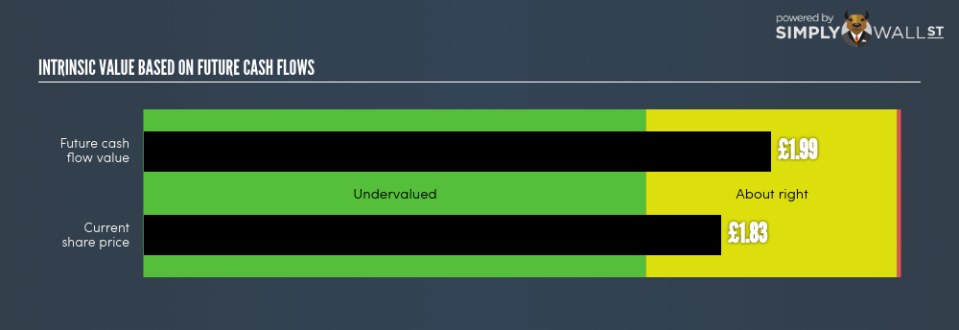
= $1.12 + $1.51 = $2.62 (£1.99)
This results in an intrinsic value in the company’s reported currency of $2.62. However, EMG’s primary listing is in United Kingdom, and 1 share of EMG in USD represents 0.759 ( USD/ GBP) share of OTCPK:MNGP.F, so the intrinsic value per share in GBP is £1.99. Relative to today’s price of UK£1.83, EMG is priced in-line with its intrinsic value. This means there’s no real upside in buying EMG at its current price. Pricing is one part of the analysis of your potential investment in EMG. Fundamental factors are key to determining if EMG fits with the rest of your portfolio holdings.
Next Steps:
For capital markets, there are three key aspects you should look at:
Financial health: Does it have a healthy balance sheet? Take a look at our free bank analysis with six simple checks on things like leverage and risk.
Future earnings: What does the market think of EMG going forward? Our analyst growth expectation chart helps visualize EMG’s growth potential over the upcoming years.
Dividends: Most people buy financial stocks for their healthy and stable dividends. Check out whether EMG is a dividend Rockstar with our historical and future dividend analysis.
For more details and sources, take a look at our full calculation on EMG here.
To help readers see pass the short term volatility of the financial market, we aim to bring you a long-term focused research analysis purely driven by fundamental data. Note that our analysis does not factor in the latest price sensitive company announcements.
The author is an independent contributor and at the time of publication had no position in the stocks mentioned.
