
 Yahoo Finance
 Are Investors Undervaluing XP Power Limited (LON:XPP) By 47%?
Today we'll do a simple run through of a valuation method used to estimate the attractiveness of XP Power Limited (LON:XPP) as an investment opportunity by projecting its future cash flows and then discounting them to today's value. We will take advantage of the Discounted Cash Flow (DCF) model for this purpose. Before you think you won't be able to understand it, just read on! It's actually much less complex than you'd imagine.
Companies can be valued in a lot of ways, so we would point out that a DCF is not perfect for every situation. If you still have some burning questions about this type of valuation, take a look at the Simply Wall St analysis model.
See our latest analysis for XP Power
Step By Step Through The Calculation
We are going to use a two-stage DCF model, which, as the name states, takes into account two stages of growth. The first stage is generally a higher growth period which levels off heading towards the terminal value, captured in the second 'steady growth' period. In the first stage we need to estimate the cash flows to the business over the next ten years. Where possible we use analyst estimates, but when these aren't available we extrapolate the previous free cash flow (FCF) from the last estimate or reported value. We assume companies with shrinking free cash flow will slow their rate of shrinkage, and that companies with growing free cash flow will see their growth rate slow, over this period. We do this to reflect that growth tends to slow more in the early years than it does in later years.
Generally we assume that a dollar today is more valuable than a dollar in the future, so we need to discount the sum of these future cash flows to arrive at a present value estimate:
10-year free cash flow (FCF) estimate
2023 | 2024 | 2025 | 2026 | 2027 | 2028 | 2029 | 2030 | 2031 | 2032 | |
Levered FCF (£, Millions) | UK£27.2m | UK£39.9m | UK£49.7m | UK£58.4m | UK£65.8m | UK£71.8m | UK£76.6m | UK£80.4m | UK£83.5m | UK£85.9m |
Growth Rate Estimate Source | Analyst x4 | Analyst x3 | Est @ 24.69% | Est @ 17.58% | Est @ 12.60% | Est @ 9.12% | Est @ 6.68% | Est @ 4.97% | Est @ 3.78% | Est @ 2.94% |
Present Value (£, Millions) Discounted @ 9.2% | UK£24.9 | UK£33.4 | UK£38.2 | UK£41.1 | UK£42.4 | UK£42.4 | UK£41.4 | UK£39.9 | UK£37.9 | UK£35.7 |
("Est" = FCF growth rate estimated by Simply Wall St)
Present Value of 10-year Cash Flow (PVCF) = UK£377m
The second stage is also known as Terminal Value, this is the business's cash flow after the first stage. For a number of reasons a very conservative growth rate is used that cannot exceed that of a country's GDP growth. In this case we have used the 5-year average of the 10-year government bond yield (1.0%) to estimate future growth. In the same way as with the 10-year 'growth' period, we discount future cash flows to today's value, using a cost of equity of 9.2%.
Terminal Value (TV)= FCF2032 × (1 + g) ÷ (r – g) = UK£86m× (1 + 1.0%) ÷ (9.2%– 1.0%) = UK£1.1b
Present Value of Terminal Value (PVTV)= TV / (1 + r)10= UK£1.1b÷ ( 1 + 9.2%)10= UK£441m
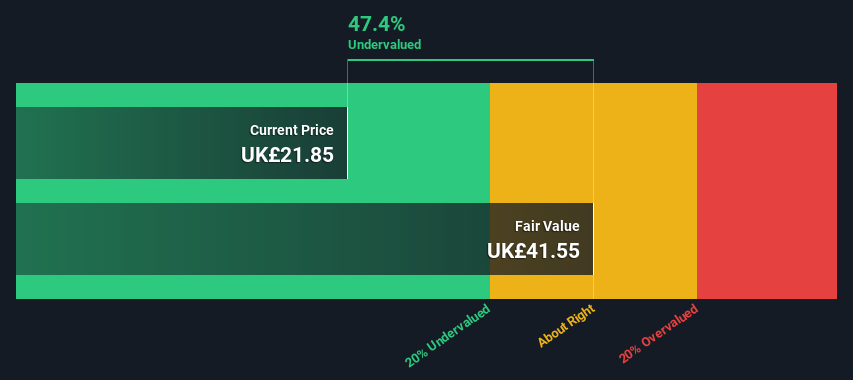
The total value is the sum of cash flows for the next ten years plus the discounted terminal value, which results in the Total Equity Value, which in this case is UK£818m. The last step is to then divide the equity value by the number of shares outstanding. Compared to the current share price of UK£21.9, the company appears quite undervalued at a 47% discount to where the stock price trades currently. Remember though, that this is just an approximate valuation, and like any complex formula - garbage in, garbage out.
Important Assumptions
We would point out that the most important inputs to a discounted cash flow are the discount rate and of course the actual cash flows. You don't have to agree with these inputs, I recommend redoing the calculations yourself and playing with them. The DCF also does not consider the possible cyclicality of an industry, or a company's future capital requirements, so it does not give a full picture of a company's potential performance. Given that we are looking at XP Power as potential shareholders, the cost of equity is used as the discount rate, rather than the cost of capital (or weighted average cost of capital, WACC) which accounts for debt. In this calculation we've used 9.2%, which is based on a levered beta of 1.361. Beta is a measure of a stock's volatility, compared to the market as a whole. We get our beta from the industry average beta of globally comparable companies, with an imposed limit between 0.8 and 2.0, which is a reasonable range for a stable business.
SWOT Analysis for XP Power
Strength
No major strengths identified for XPP.
Weakness
Dividend is low compared to the top 25% of dividend payers in the Electrical market.
Opportunity
Expected to breakeven next year.
Has sufficient cash runway for more than 3 years based on current free cash flows.
Trading below our estimate of fair value by more than 20%.
Significant insider buying over the past 3 months.
Threat
Debt is not well covered by operating cash flow.
Paying a dividend but company is unprofitable.
Next Steps:
Although the valuation of a company is important, it shouldn't be the only metric you look at when researching a company. It's not possible to obtain a foolproof valuation with a DCF model. Rather it should be seen as a guide to "what assumptions need to be true for this stock to be under/overvalued?" For example, changes in the company's cost of equity or the risk free rate can significantly impact the valuation. What is the reason for the share price sitting below the intrinsic value? For XP Power, there are three additional aspects you should consider:
Risks: Be aware that XP Power is showing 3 warning signs in our investment analysis , and 2 of those shouldn't be ignored...
Management:Have insiders been ramping up their shares to take advantage of the market's sentiment for XPP's future outlook? Check out our management and board analysis with insights on CEO compensation and governance factors.
Other High Quality Alternatives: Do you like a good all-rounder? Explore our interactive list of high quality stocks to get an idea of what else is out there you may be missing!
PS. The Simply Wall St app conducts a discounted cash flow valuation for every stock on the LSE every day. If you want to find the calculation for other stocks just search here.
Have feedback on this article? Concerned about the content? Get in touch with us directly. Alternatively, email editorial-team (at) simplywallst.com.
This article by Simply Wall St is general in nature. We provide commentary based on historical data and analyst forecasts only using an unbiased methodology and our articles are not intended to be financial advice. It does not constitute a recommendation to buy or sell any stock, and does not take account of your objectives, or your financial situation. We aim to bring you long-term focused analysis driven by fundamental data. Note that our analysis may not factor in the latest price-sensitive company announcements or qualitative material. Simply Wall St has no position in any stocks mentioned.
Join A Paid User Research Session
You’ll receive a US$30 Amazon Gift card for 1 hour of your time while helping us build better investing tools for the individual investors like yourself. Sign up here
