
 Yahoo Finance
 Can investors use value and momentum strategies in European markets?
We regularly get emails from users asking us whether the successful European StockRanks have been backtested further than their June 2013 start date. While we don’t yet have the point in time data to do this internally, we can gain insights into past performance by exploring the extensive academic literature on factor investing. Indeed, some of the academics and practitioners that inspired the StockRanks have analysed how value and momentum strategies have performed in Europe since the 1970s. Have these market anomalies always existed in European markets, and if so, how can individual investors exploit them? Let’s take a closer look...
Cheap beats expensive overseas?
Back in 1993 two professors, Eugene Fama and Ken French made their mark in academic finance by pinpointing two factors that drive stock price returns: size and value. In a nutshell, they observed that value stocks beat growth stocks while small stocks outperform large stocks. A few years later -in a paper titled Value versus Growth: The International Evidence (1998)- the two academics examined stock returns between between 1975 and 1995, in order to discover whether the value effect existed in overseas stockmarkets. They found that ‘value stocks outperform growth stocks in twelve of thirteen major markets’ tested.
The following charts have been put together using data from Fama and French’s paper: Value versus Growth: The International Evidence. They illustrate the amount by which cheap P/E stocks outperformed expensive P/E stocks (ie. the value premium). In many cases the premium was actually stronger in European markets than in the UK. For example, in Sweden, cheap P/E stocks beat expensive stocks by around 8% per annum.

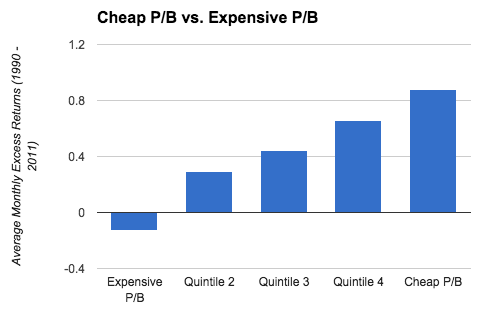
Fama and French also explored whether companies that are cheap against what they own (low Price to Book stocks) beat their expensive counterparts (high Price to Book stocks). Again, cheap stocks outperformed. For example:

Some readers may be wondering whether the value premium has been arbitraged away since the 1990s. To help address this question Fama and French published another paper in 2012, titled Size, Value, and Momentum in International Stock Returns. They examined stock returns between 1990 and 2011 and their conclusion was that ‘we find value premiums in average returns in all four regions we examine (North America, Europe, Japan, and Asia Pacific)’.The two professors grouped stocks into quintiles of cheap and expensive P/B stocks (see below). Quintile 4 is cheaper than Quintile 3 and so on. Again, we can see that the quintiles of cheap stocks beat the expensive stocks.
What about momentum?
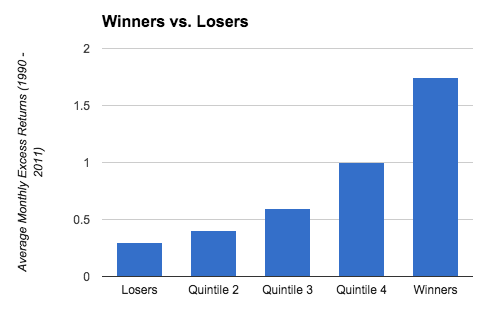
Investors have been aware of the value effect since the 1930s, when Benjamin Graham wrote The Intelligent Investor. Since then, market anomalies have kept appearing on the horizon like bandits threatening to shoot down the ‘efficient markets theory’ forever. One of the more famous anomalies is the momentum effect, whereby market ‘winners’ (ie. stocks that have beaten the market) go on to beat stocks which have underperformed the market. Did Fama and French find that market ‘winners’ beat ‘losers’ in Europe? Yes. At least between 1990 and 2011, as we can see from the chart below.
Where is the value and momentum now?
So Fama and French have clearly demonstrated the historic effectiveness of Value and Momentum across Europe. If we believed these strategies will continue to outperform how can we find stocks exposed to these factors? Stockopedia's VM Rank (Value and Momentum Rank) is ideally suited to this sort of screening. The VM Rank scores every company in the market based on a range of value and momentum metrics, including the P/E and P/B ratios, in addition to a company's relative strength performance. You can use the StockRank Portal to find companies with the highest VM-Rank.
The table below shows companies with the highest VM-Ranks in Europe. We have also added an additional rule to filter for companies with strong price momentum over the last twelve months. We did this because while our MomentumRank takes account of price returns and earnings momentum (eg. EPS estimate upgrades) Fama and French defined momentum as ‘lagged momentum return’ (ie. price returns).
Let’s take a look at some of the companies that make the grade. The Swedish pulp producer, Rottneros, has the profile of a turnaround stock. Profits were negative between 2011-13 but earnings have more than doubled over the last twelve months and the share price has risen by over 40%. Perhaps investors are excited by the growth in sales and profits, and are encouraged by the company’s plans to grow pump production to 460,000 tonnes per year, compared to 345,000 tonnes in 2014.
Poland’s Trakcja PRKiI is engaged in the rail infrastructure business. It is one of the largest construction companies in Poland. Earnings were negative in 2012 (-0.36PLN per share), but bounced back in 2013 (60PLN per share) thanks in part to a reorganisation which improved the process of contract execution improved and simplified the company’s organisational structure (see here).
Name | Mkt Cap £m | VM Rank | P/B | % Price Chg 1y | Flag |
Trakcja PRKiI SA | 106.3 | 99 | 0.87 | 39.2 | Poland |
NN NV | 7,373 | 99 | 0.49 | 24.7 | Netherlands |
Rottneros AB | 88.4 | 99 | 0.95 | 33.3 | Sweden |
BW LPG | 650.3 | 99 | 0.88 | 16.3 | Norway |
Anadolu Anonim Turk | 182.5 | 99 | 0.97 | 14.1 | Turkey |
Selvaag Bolig ASA | 188 | 99 | 0.93 | 27.6 | Norway |
Trans-Siberian Gold | 20.2 | 99 | 0.37 | 70.9 | United Kingdom |
Gyldendal A/S | 54.8 | 99 | 1.52 | 26.5 | Denmark |
Bulgartabac Holding AD Sofia | 200.4 | 99 | 1.28 | 53.3 | Bulgaria |
Stirom SA | 22.4 | 99 | 0.44 | 62 | Romania |
Since we began tracking VM-Rank in June 2013, the basket of annually rebalanced stocks in the top 10% of the market for VM Rank returned 51%. The bottom 10% - lowest VM stocks - fell by around 12% on average, while the market has returned around 12% over the same timeframe.

The performance of the VM-Rank, in addition to Fama and French’s latest research suggests that investment strategies that have worked in the UK may have also worked overseas. Investors could have outperformed the market in both the UK and Europe buy investing in a diversified portfolio of cheap, high momentum stocks. Unfortunately Fama and French did not address the ‘quality’ factor in their studies on international shares, but this is an area we can investigate amongst other academic studies another time.
Read More about Rottneros AB on Stockopedia
Discuss Rottneros AB on Stockopedia
