
 Yahoo Finance
 Investors in Velan (TSE:VLN) have made a favorable return of 53% over the past year
The simplest way to invest in stocks is to buy exchange traded funds. But if you pick the right individual stocks, you could make more than that. For example, the Velan Inc. (TSE:VLN) share price is up 53% in the last 1 year, clearly besting the market return of around 29% (not including dividends). That's a solid performance by our standards! In contrast, the longer term returns are negative, since the share price is 9.8% lower than it was three years ago.
With that in mind, it's worth seeing if the company's underlying fundamentals have been the driver of long term performance, or if there are some discrepancies.
View our latest analysis for Velan
While markets are a powerful pricing mechanism, share prices reflect investor sentiment, not just underlying business performance. One imperfect but simple way to consider how the market perception of a company has shifted is to compare the change in the earnings per share (EPS) with the share price movement.
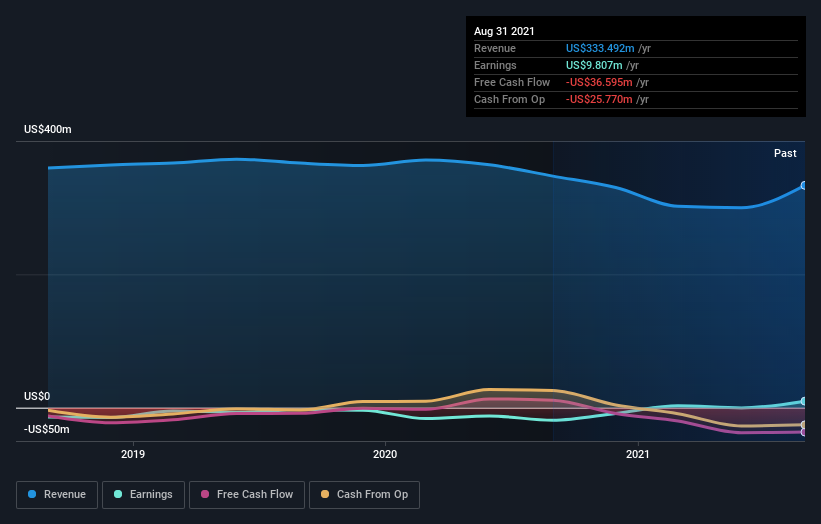
During the last year Velan grew its earnings per share, moving from a loss to a profit.
When a company is just on the edge of profitability it can be well worth considering other metrics in order to more precisely gauge growth (and therefore understand share price movements).
Unfortunately Velan's fell 4.0% over twelve months. So using a snapshot of key business metrics doesn't give us a good picture of why the market is bidding up the stock.
The company's revenue and earnings (over time) are depicted in the image below (click to see the exact numbers).
It's probably worth noting we've seen significant insider buying in the last quarter, which we consider a positive. On the other hand, we think the revenue and earnings trends are much more meaningful measures of the business. Before buying or selling a stock, we always recommend a close examination of historic growth trends, available here..
A Different Perspective
It's nice to see that Velan shareholders have received a total shareholder return of 53% over the last year. Notably the five-year annualised TSR loss of 8% per year compares very unfavourably with the recent share price performance. We generally put more weight on the long term performance over the short term, but the recent improvement could hint at a (positive) inflection point within the business. While it is well worth considering the different impacts that market conditions can have on the share price, there are other factors that are even more important. For instance, we've identified 1 warning sign for Velan that you should be aware of.
Velan is not the only stock that insiders are buying. For those who like to find winning investments this free list of growing companies with recent insider purchasing, could be just the ticket.
Please note, the market returns quoted in this article reflect the market weighted average returns of stocks that currently trade on CA exchanges.
This article by Simply Wall St is general in nature. We provide commentary based on historical data and analyst forecasts only using an unbiased methodology and our articles are not intended to be financial advice. It does not constitute a recommendation to buy or sell any stock, and does not take account of your objectives, or your financial situation. We aim to bring you long-term focused analysis driven by fundamental data. Note that our analysis may not factor in the latest price-sensitive company announcements or qualitative material. Simply Wall St has no position in any stocks mentioned.
Have feedback on this article? Concerned about the content? Get in touch with us directly. Alternatively, email editorial-team (at) simplywallst.com.
