
 Yahoo Finance
 Investors Will Want COSCO SHIPPING International (Singapore)'s (SGX:F83) Growth In ROCE To Persist
If we want to find a stock that could multiply over the long term, what are the underlying trends we should look for? Amongst other things, we'll want to see two things; firstly, a growing return on capital employed (ROCE) and secondly, an expansion in the company's amount of capital employed. Ultimately, this demonstrates that it's a business that is reinvesting profits at increasing rates of return. So on that note, COSCO SHIPPING International (Singapore) (SGX:F83) looks quite promising in regards to its trends of return on capital.
Understanding Return On Capital Employed (ROCE)
If you haven't worked with ROCE before, it measures the 'return' (pre-tax profit) a company generates from capital employed in its business. To calculate this metric for COSCO SHIPPING International (Singapore), this is the formula:
Return on Capital Employed = Earnings Before Interest and Tax (EBIT) ÷ (Total Assets - Current Liabilities)
0.017 = S$14m ÷ (S$889m - S$87m) (Based on the trailing twelve months to June 2023).
Therefore, COSCO SHIPPING International (Singapore) has an ROCE of 1.7%. Ultimately, that's a low return and it under-performs the Logistics industry average of 7.4%.
View our latest analysis for COSCO SHIPPING International (Singapore)
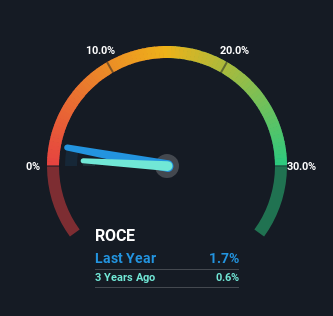
Historical performance is a great place to start when researching a stock so above you can see the gauge for COSCO SHIPPING International (Singapore)'s ROCE against it's prior returns. If you want to delve into the historical earnings , check out these free graphs detailing revenue and cash flow performance of COSCO SHIPPING International (Singapore).
The Trend Of ROCE
Even though ROCE is still low in absolute terms, it's good to see it's heading in the right direction. The figures show that over the last five years, ROCE has grown 134% whilst employing roughly the same amount of capital. So our take on this is that the business has increased efficiencies to generate these higher returns, all the while not needing to make any additional investments. On that front, things are looking good so it's worth exploring what management has said about growth plans going forward.
The Bottom Line
As discussed above, COSCO SHIPPING International (Singapore) appears to be getting more proficient at generating returns since capital employed has remained flat but earnings (before interest and tax) are up. And since the stock has fallen 61% over the last five years, there might be an opportunity here. That being the case, research into the company's current valuation metrics and future prospects seems fitting.
COSCO SHIPPING International (Singapore) does have some risks, we noticed 2 warning signs (and 1 which makes us a bit uncomfortable) we think you should know about.
While COSCO SHIPPING International (Singapore) may not currently earn the highest returns, we've compiled a list of companies that currently earn more than 25% return on equity. Check out this free list here.
Have feedback on this article? Concerned about the content? Get in touch with us directly. Alternatively, email editorial-team (at) simplywallst.com.
This article by Simply Wall St is general in nature. We provide commentary based on historical data and analyst forecasts only using an unbiased methodology and our articles are not intended to be financial advice. It does not constitute a recommendation to buy or sell any stock, and does not take account of your objectives, or your financial situation. We aim to bring you long-term focused analysis driven by fundamental data. Note that our analysis may not factor in the latest price-sensitive company announcements or qualitative material. Simply Wall St has no position in any stocks mentioned.
