
 Yahoo Finance
 Investors Will Want KATEK's (ETR:KTEK) Growth In ROCE To Persist
If we want to find a potential multi-bagger, often there are underlying trends that can provide clues. Typically, we'll want to notice a trend of growing return on capital employed (ROCE) and alongside that, an expanding base of capital employed. Put simply, these types of businesses are compounding machines, meaning they are continually reinvesting their earnings at ever-higher rates of return. So when we looked at KATEK (ETR:KTEK) and its trend of ROCE, we really liked what we saw.
What Is Return On Capital Employed (ROCE)?
Just to clarify if you're unsure, ROCE is a metric for evaluating how much pre-tax income (in percentage terms) a company earns on the capital invested in its business. To calculate this metric for KATEK, this is the formula:
Return on Capital Employed = Earnings Before Interest and Tax (EBIT) ÷ (Total Assets - Current Liabilities)
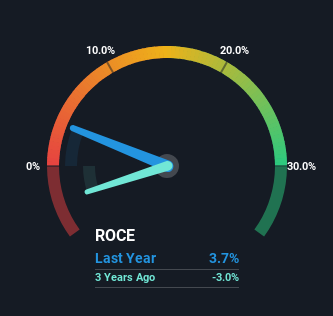
0.037 = €12m ÷ (€546m - €221m) (Based on the trailing twelve months to September 2023).
Thus, KATEK has an ROCE of 3.7%. Ultimately, that's a low return and it under-performs the Electronic industry average of 10%.
Check out our latest analysis for KATEK
Above you can see how the current ROCE for KATEK compares to its prior returns on capital, but there's only so much you can tell from the past. If you'd like, you can check out the forecasts from the analysts covering KATEK here for free.
So How Is KATEK's ROCE Trending?
We're delighted to see that KATEK is reaping rewards from its investments and is now generating some pre-tax profits. About three years ago the company was generating losses but things have turned around because it's now earning 3.7% on its capital. In addition to that, KATEK is employing 136% more capital than previously which is expected of a company that's trying to break into profitability. We like this trend, because it tells us the company has profitable reinvestment opportunities available to it, and if it continues going forward that can lead to a multi-bagger performance.
Another thing to note, KATEK has a high ratio of current liabilities to total assets of 40%. This effectively means that suppliers (or short-term creditors) are funding a large portion of the business, so just be aware that this can introduce some elements of risk. While it's not necessarily a bad thing, it can be beneficial if this ratio is lower.
In Conclusion...
In summary, it's great to see that KATEK has managed to break into profitability and is continuing to reinvest in its business. Given the stock has declined 19% in the last year, this could be a good investment if the valuation and other metrics are also appealing. That being the case, research into the company's current valuation metrics and future prospects seems fitting.
If you want to continue researching KATEK, you might be interested to know about the 1 warning sign that our analysis has discovered.
While KATEK may not currently earn the highest returns, we've compiled a list of companies that currently earn more than 25% return on equity. Check out this free list here.
Have feedback on this article? Concerned about the content? Get in touch with us directly. Alternatively, email editorial-team (at) simplywallst.com.
This article by Simply Wall St is general in nature. We provide commentary based on historical data and analyst forecasts only using an unbiased methodology and our articles are not intended to be financial advice. It does not constitute a recommendation to buy or sell any stock, and does not take account of your objectives, or your financial situation. We aim to bring you long-term focused analysis driven by fundamental data. Note that our analysis may not factor in the latest price-sensitive company announcements or qualitative material. Simply Wall St has no position in any stocks mentioned.
