
 Yahoo Finance
 Investors Will Want Shengfeng Development's (NASDAQ:SFWL) Growth In ROCE To Persist
There are a few key trends to look for if we want to identify the next multi-bagger. Firstly, we'd want to identify a growing return on capital employed (ROCE) and then alongside that, an ever-increasing base of capital employed. Basically this means that a company has profitable initiatives that it can continue to reinvest in, which is a trait of a compounding machine. So when we looked at Shengfeng Development (NASDAQ:SFWL) and its trend of ROCE, we really liked what we saw.
Understanding Return On Capital Employed (ROCE)
For those who don't know, ROCE is a measure of a company's yearly pre-tax profit (its return), relative to the capital employed in the business. To calculate this metric for Shengfeng Development, this is the formula:
Return on Capital Employed = Earnings Before Interest and Tax (EBIT) ÷ (Total Assets - Current Liabilities)
0.11 = US$14m ÷ (US$266m - US$136m) (Based on the trailing twelve months to December 2023).
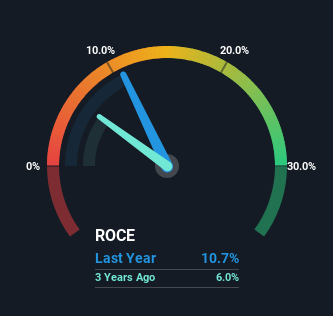
Thus, Shengfeng Development has an ROCE of 11%. That's a relatively normal return on capital, and it's around the 9.6% generated by the Logistics industry.
View our latest analysis for Shengfeng Development
While the past is not representative of the future, it can be helpful to know how a company has performed historically, which is why we have this chart above. If you want to delve into the historical earnings , check out these free graphs detailing revenue and cash flow performance of Shengfeng Development.
What Does the ROCE Trend For Shengfeng Development Tell Us?
Investors would be pleased with what's happening at Shengfeng Development. The data shows that returns on capital have increased substantially over the last four years to 11%. The amount of capital employed has increased too, by 44%. The increasing returns on a growing amount of capital is common amongst multi-baggers and that's why we're impressed.
On a side note, Shengfeng Development's current liabilities are still rather high at 51% of total assets. This effectively means that suppliers (or short-term creditors) are funding a large portion of the business, so just be aware that this can introduce some elements of risk. While it's not necessarily a bad thing, it can be beneficial if this ratio is lower.
The Bottom Line On Shengfeng Development's ROCE
To sum it up, Shengfeng Development has proven it can reinvest in the business and generate higher returns on that capital employed, which is terrific. Astute investors may have an opportunity here because the stock has declined 70% in the last year. That being the case, research into the company's current valuation metrics and future prospects seems fitting.
If you want to know some of the risks facing Shengfeng Development we've found 2 warning signs (1 is a bit concerning!) that you should be aware of before investing here.
If you want to search for solid companies with great earnings, check out this free list of companies with good balance sheets and impressive returns on equity.
Have feedback on this article? Concerned about the content? Get in touch with us directly. Alternatively, email editorial-team (at) simplywallst.com.
This article by Simply Wall St is general in nature. We provide commentary based on historical data and analyst forecasts only using an unbiased methodology and our articles are not intended to be financial advice. It does not constitute a recommendation to buy or sell any stock, and does not take account of your objectives, or your financial situation. We aim to bring you long-term focused analysis driven by fundamental data. Note that our analysis may not factor in the latest price-sensitive company announcements or qualitative material. Simply Wall St has no position in any stocks mentioned.
