
 Yahoo Finance
 Investors Will Want TAT Technologies' (NASDAQ:TATT) Growth In ROCE To Persist
Did you know there are some financial metrics that can provide clues of a potential multi-bagger? Firstly, we'd want to identify a growing return on capital employed (ROCE) and then alongside that, an ever-increasing base of capital employed. If you see this, it typically means it's a company with a great business model and plenty of profitable reinvestment opportunities. Speaking of which, we noticed some great changes in TAT Technologies' (NASDAQ:TATT) returns on capital, so let's have a look.
Return On Capital Employed (ROCE): What Is It?
If you haven't worked with ROCE before, it measures the 'return' (pre-tax profit) a company generates from capital employed in its business. The formula for this calculation on TAT Technologies is:
Return on Capital Employed = Earnings Before Interest and Tax (EBIT) ÷ (Total Assets - Current Liabilities)
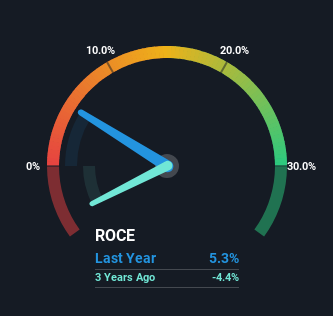
0.053 = US$5.6m ÷ (US$146m - US$39m) (Based on the trailing twelve months to December 2023).
Thus, TAT Technologies has an ROCE of 5.3%. In absolute terms, that's a low return and it also under-performs the Aerospace & Defense industry average of 9.7%.
View our latest analysis for TAT Technologies
While the past is not representative of the future, it can be helpful to know how a company has performed historically, which is why we have this chart above. If you're interested in investigating TAT Technologies' past further, check out this free graph covering TAT Technologies' past earnings, revenue and cash flow.
What Can We Tell From TAT Technologies' ROCE Trend?
Shareholders will be relieved that TAT Technologies has broken into profitability. The company was generating losses five years ago, but has managed to turn it around and as we saw earlier is now earning 5.3%, which is always encouraging. Interestingly, the capital employed by the business has remained relatively flat, so these higher returns are either from prior investments paying off or increased efficiencies. So while we're happy that the business is more efficient, just keep in mind that could mean that going forward the business is lacking areas to invest internally for growth. So if you're looking for high growth, you'll want to see a business's capital employed also increasing.
On a side note, we noticed that the improvement in ROCE appears to be partly fueled by an increase in current liabilities. Effectively this means that suppliers or short-term creditors are now funding 27% of the business, which is more than it was five years ago. It's worth keeping an eye on this because as the percentage of current liabilities to total assets increases, some aspects of risk also increase.
The Bottom Line
To bring it all together, TAT Technologies has done well to increase the returns it's generating from its capital employed. Since the stock has returned a solid 75% to shareholders over the last five years, it's fair to say investors are beginning to recognize these changes. Therefore, we think it would be worth your time to check if these trends are going to continue.
If you want to continue researching TAT Technologies, you might be interested to know about the 1 warning sign that our analysis has discovered.
For those who like to invest in solid companies, check out this free list of companies with solid balance sheets and high returns on equity.
Have feedback on this article? Concerned about the content? Get in touch with us directly. Alternatively, email editorial-team (at) simplywallst.com.
This article by Simply Wall St is general in nature. We provide commentary based on historical data and analyst forecasts only using an unbiased methodology and our articles are not intended to be financial advice. It does not constitute a recommendation to buy or sell any stock, and does not take account of your objectives, or your financial situation. We aim to bring you long-term focused analysis driven by fundamental data. Note that our analysis may not factor in the latest price-sensitive company announcements or qualitative material. Simply Wall St has no position in any stocks mentioned.
