
 Yahoo Finance
 Investors in XLMedia (LON:XLM) have unfortunately lost 69% over the last five years
While not a mind-blowing move, it is good to see that the XLMedia PLC (LON:XLM) share price has gained 25% in the last three months. But that is little comfort to those holding over the last half decade, sitting on a big loss. In that time the share price has delivered a rude shock to holders, who find themselves down 74% after a long stretch. So we're not so sure if the recent bounce should be celebrated. We'd err towards caution given the long term under-performance.
So let's have a look and see if the longer term performance of the company has been in line with the underlying business' progress.
Check out our latest analysis for XLMedia
In his essay The Superinvestors of Graham-and-Doddsville Warren Buffett described how share prices do not always rationally reflect the value of a business. One imperfect but simple way to consider how the market perception of a company has shifted is to compare the change in the earnings per share (EPS) with the share price movement.
During the five years over which the share price declined, XLMedia's earnings per share (EPS) dropped by 29% each year. This fall in the EPS is worse than the 23% compound annual share price fall. So the market may previously have expected a drop, or else it expects the situation will improve.
You can see below how EPS has changed over time (discover the exact values by clicking on the image).
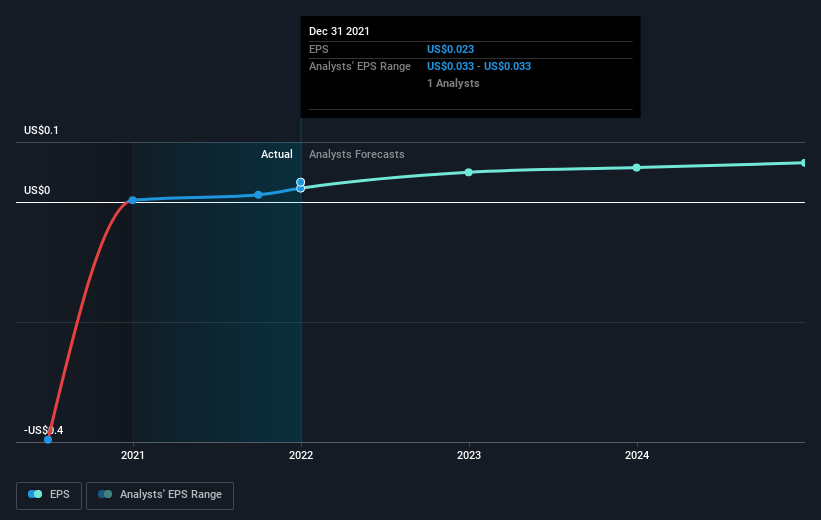
We know that XLMedia has improved its bottom line lately, but is it going to grow revenue? You could check out this free report showing analyst revenue forecasts.
What about the Total Shareholder Return (TSR)?
Investors should note that there's a difference between XLMedia's total shareholder return (TSR) and its share price change, which we've covered above. Arguably the TSR is a more complete return calculation because it accounts for the value of dividends (as if they were reinvested), along with the hypothetical value of any discounted capital that have been offered to shareholders. Its history of dividend payouts mean that XLMedia's TSR, which was a 69% drop over the last 5 years, was not as bad as the share price return.
A Different Perspective
Investors in XLMedia had a tough year, with a total loss of 33%, against a market gain of about 0.5%. However, keep in mind that even the best stocks will sometimes underperform the market over a twelve month period. Regrettably, last year's performance caps off a bad run, with the shareholders facing a total loss of 11% per year over five years. Generally speaking long term share price weakness can be a bad sign, though contrarian investors might want to research the stock in hope of a turnaround. While it is well worth considering the different impacts that market conditions can have on the share price, there are other factors that are even more important. For instance, we've identified 2 warning signs for XLMedia (1 is concerning) that you should be aware of.
If you would prefer to check out another company -- one with potentially superior financials -- then do not miss this free list of companies that have proven they can grow earnings.
Please note, the market returns quoted in this article reflect the market weighted average returns of stocks that currently trade on GB exchanges.
Have feedback on this article? Concerned about the content? Get in touch with us directly. Alternatively, email editorial-team (at) simplywallst.com.
This article by Simply Wall St is general in nature. We provide commentary based on historical data and analyst forecasts only using an unbiased methodology and our articles are not intended to be financial advice. It does not constitute a recommendation to buy or sell any stock, and does not take account of your objectives, or your financial situation. We aim to bring you long-term focused analysis driven by fundamental data. Note that our analysis may not factor in the latest price-sensitive company announcements or qualitative material. Simply Wall St has no position in any stocks mentioned.
