
 Yahoo Finance
 Investors in XPO (NYSE:XPO) have seen returns of 25% over the past five years
It is doubtless a positive to see that the XPO, Inc. (NYSE:XPO) share price has gained some 34% in the last three months. But if you look at the last five years the returns have not been good. After all, the share price is down 57% in that time, significantly under-performing the market.
With that in mind, it's worth seeing if the company's underlying fundamentals have been the driver of long term performance, or if there are some discrepancies.
View our latest analysis for XPO
While the efficient markets hypothesis continues to be taught by some, it has been proven that markets are over-reactive dynamic systems, and investors are not always rational. One imperfect but simple way to consider how the market perception of a company has shifted is to compare the change in the earnings per share (EPS) with the share price movement.
Looking back five years, both XPO's share price and EPS declined; the latter at a rate of 14% per year. Notably, the share price has fallen at 15% per year, fairly close to the change in the EPS. This suggests that market participants have not changed their view of the company all that much. So it's fair to say the share price has been responding to changes in EPS.
The company's earnings per share (over time) is depicted in the image below (click to see the exact numbers).
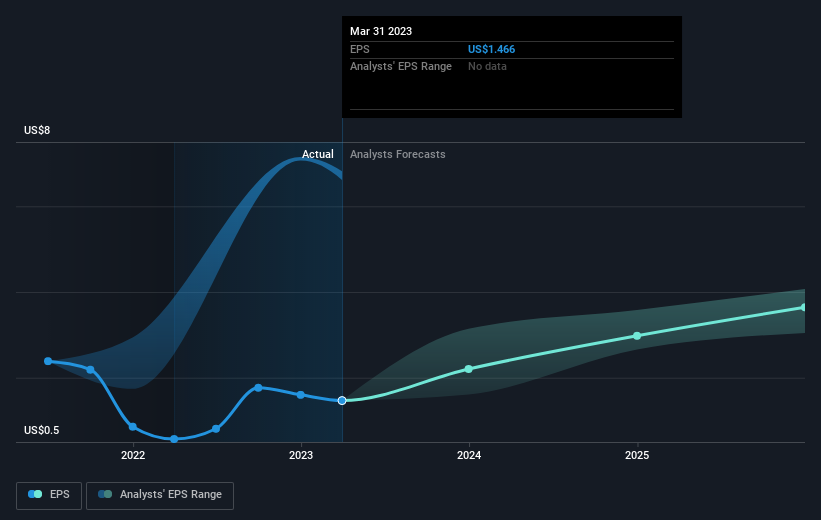
We know that XPO has improved its bottom line lately, but is it going to grow revenue? Check if analysts think XPO will grow revenue in the future.
What About The Total Shareholder Return (TSR)?
We'd be remiss not to mention the difference between XPO's total shareholder return (TSR) and its share price return. The TSR attempts to capture the value of dividends (as if they were reinvested) as well as any spin-offs or discounted capital raisings offered to shareholders. We note that XPO's TSR, at 25% is higher than its share price return of -57%. When you consider it hasn't been paying a dividend, this data suggests shareholders have benefitted from a spin-off, or had the opportunity to acquire attractively priced shares in a discounted capital raising.
A Different Perspective
It's nice to see that XPO shareholders have received a total shareholder return of 60% over the last year. That's better than the annualised return of 5% over half a decade, implying that the company is doing better recently. In the best case scenario, this may hint at some real business momentum, implying that now could be a great time to delve deeper. While it is well worth considering the different impacts that market conditions can have on the share price, there are other factors that are even more important. For instance, we've identified 2 warning signs for XPO that you should be aware of.
For those who like to find winning investments this free list of growing companies with recent insider purchasing, could be just the ticket.
Please note, the market returns quoted in this article reflect the market weighted average returns of stocks that currently trade on American exchanges.
Have feedback on this article? Concerned about the content? Get in touch with us directly. Alternatively, email editorial-team (at) simplywallst.com.
This article by Simply Wall St is general in nature. We provide commentary based on historical data and analyst forecasts only using an unbiased methodology and our articles are not intended to be financial advice. It does not constitute a recommendation to buy or sell any stock, and does not take account of your objectives, or your financial situation. We aim to bring you long-term focused analysis driven by fundamental data. Note that our analysis may not factor in the latest price-sensitive company announcements or qualitative material. Simply Wall St has no position in any stocks mentioned.
Join A Paid User Research Session
You’ll receive a US$30 Amazon Gift card for 1 hour of your time while helping us build better investing tools for the individual investors like yourself. Sign up here
