
 Yahoo Finance
 ITV (LON:ITV) earnings and shareholder returns have been trending downwards for the last five years, but the stock rises 3.4% this past week
For many, the main point of investing is to generate higher returns than the overall market. But every investor is virtually certain to have both over-performing and under-performing stocks. At this point some shareholders may be questioning their investment in ITV plc (LON:ITV), since the last five years saw the share price fall 45%.
While the stock has risen 3.4% in the past week but long term shareholders are still in the red, let's see what the fundamentals can tell us.
Check out our latest analysis for ITV
While markets are a powerful pricing mechanism, share prices reflect investor sentiment, not just underlying business performance. One flawed but reasonable way to assess how sentiment around a company has changed is to compare the earnings per share (EPS) with the share price.
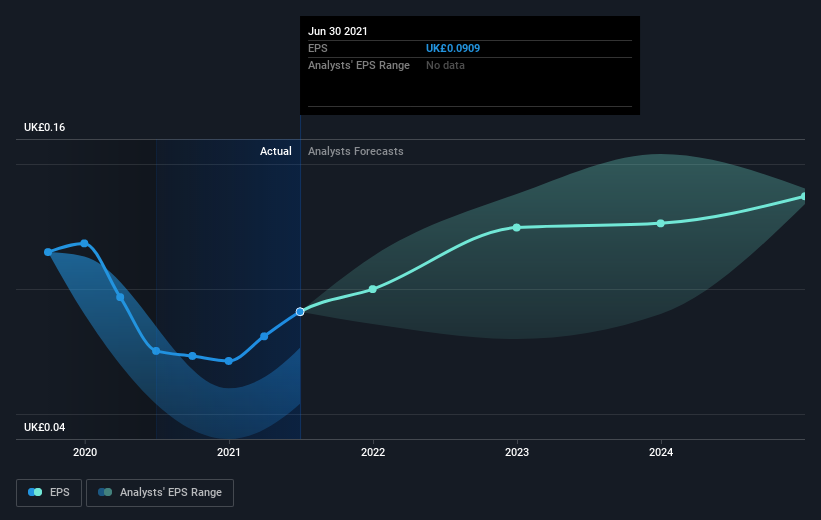
Looking back five years, both ITV's share price and EPS declined; the latter at a rate of 5.5% per year. Readers should note that the share price has fallen faster than the EPS, at a rate of 11% per year, over the period. So it seems the market was too confident about the business, in the past.
You can see how EPS has changed over time in the image below (click on the chart to see the exact values).
We know that ITV has improved its bottom line lately, but is it going to grow revenue? This free report showing analyst revenue forecasts should help you figure out if the EPS growth can be sustained.
What about the Total Shareholder Return (TSR)?
We'd be remiss not to mention the difference between ITV's total shareholder return (TSR) and its share price return. The TSR attempts to capture the value of dividends (as if they were reinvested) as well as any spin-offs or discounted capital raisings offered to shareholders. ITV's TSR of was a loss of 35% for the 5 years. That wasn't as bad as its share price return, because it has paid dividends.
A Different Perspective
ITV shareholders gained a total return of 3.9% during the year. Unfortunately this falls short of the market return. But at least that's still a gain! Over five years the TSR has been a reduction of 6% per year, over five years. So this might be a sign the business has turned its fortunes around. I find it very interesting to look at share price over the long term as a proxy for business performance. But to truly gain insight, we need to consider other information, too. Consider risks, for instance. Every company has them, and we've spotted 1 warning sign for ITV you should know about.
Of course, you might find a fantastic investment by looking elsewhere. So take a peek at this free list of companies we expect will grow earnings.
Please note, the market returns quoted in this article reflect the market weighted average returns of stocks that currently trade on GB exchanges.
Have feedback on this article? Concerned about the content? Get in touch with us directly. Alternatively, email editorial-team (at) simplywallst.com.
This article by Simply Wall St is general in nature. We provide commentary based on historical data and analyst forecasts only using an unbiased methodology and our articles are not intended to be financial advice. It does not constitute a recommendation to buy or sell any stock, and does not take account of your objectives, or your financial situation. We aim to bring you long-term focused analysis driven by fundamental data. Note that our analysis may not factor in the latest price-sensitive company announcements or qualitative material. Simply Wall St has no position in any stocks mentioned.