
 Yahoo Finance
 The James Fisher and Sons (LON:FSJ) Share Price Is Up 83% And Shareholders Are Holding On

One simple way to benefit from the stock market is to buy an index fund. But if you choose individual stocks with prowess, you can make superior returns. Just take a look at James Fisher and Sons plc (LON:FSJ), which is up 83%, over three years, soundly beating the market return of 14% (not including dividends). On the other hand, the returns haven’t been quite so good recently, with shareholders up just 38%, including dividends.
View our latest analysis for James Fisher and Sons
To paraphrase Benjamin Graham: Over the short term the market is a voting machine, but over the long term it’s a weighing machine. One imperfect but simple way to consider how the market perception of a company has shifted is to compare the change in the earnings per share (EPS) with the share price movement.
During three years of share price growth, James Fisher and Sons achieved compound earnings per share growth of 3.9% per year. In comparison, the 22% per year gain in the share price outpaces the EPS growth. This suggests that, as the business progressed over the last few years, it gained the confidence of market participants. That’s not necessarily surprising considering the three-year track record of earnings growth.
You can see below how EPS has changed over time (discover the exact values by clicking on the image).
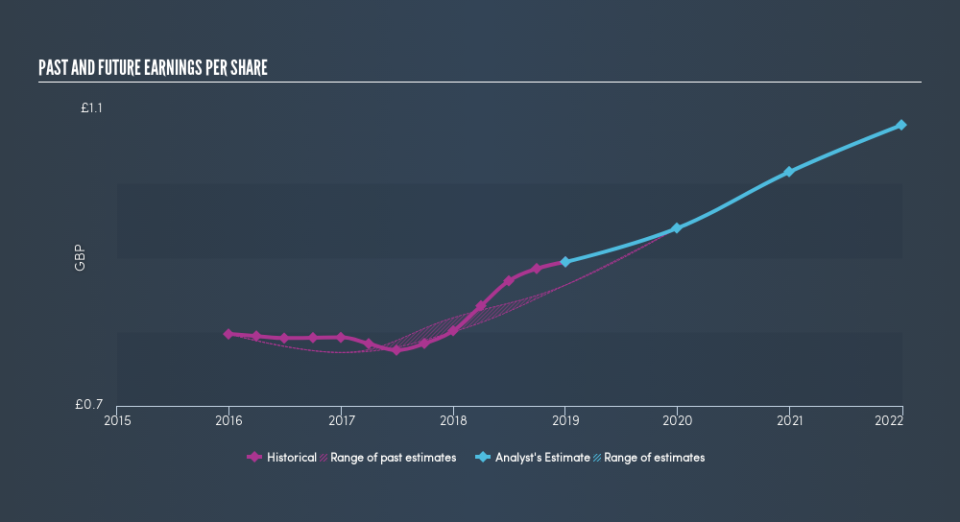
We know that James Fisher and Sons has improved its bottom line lately, but is it going to grow revenue? You could check out this free report showing analyst revenue forecasts.
What About Dividends?
When looking at investment returns, it is important to consider the difference between total shareholder return (TSR) and share price return. The TSR incorporates the value of any discounted capital raisings, along with any dividends, based on the assumption that the dividends are reinvested. So for companies that pay a generous dividend, the TSR is often a lot higher than the share price return. In the case of James Fisher and Sons, it has a TSR of 93% for the last 3 years. That exceeds its share price return that we previously mentioned. The dividends paid by the company have thusly boosted the total shareholder return.
A Different Perspective
We’re pleased to report that James Fisher and Sons shareholders have received a total shareholder return of 38% over one year. And that does include the dividend. That’s better than the annualised return of 9.6% over half a decade, implying that the company is doing better recently. Someone with an optimistic perspective could view the recent improvement in TSR as indicating that the business itself is getting better with time. Before forming an opinion on James Fisher and Sons you might want to consider these 3 valuation metrics.
For those who like to find winning investments this free list of growing companies with recent insider purchasing, could be just the ticket.
Please note, the market returns quoted in this article reflect the market weighted average returns of stocks that currently trade on GB exchanges.
We aim to bring you long-term focused research analysis driven by fundamental data. Note that our analysis may not factor in the latest price-sensitive company announcements or qualitative material.
If you spot an error that warrants correction, please contact the editor at editorial-team@simplywallst.com. This article by Simply Wall St is general in nature. It does not constitute a recommendation to buy or sell any stock, and does not take account of your objectives, or your financial situation. Simply Wall St has no position in the stocks mentioned. Thank you for reading.
