
 Yahoo Finance
 Is James Fisher and Sons plc's (LON:FSJ) Balance Sheet Strong Enough To Weather A Storm?

Want to participate in a short research study? Help shape the future of investing tools and you could win a $250 gift card!
James Fisher and Sons plc (LON:FSJ) is a small-cap stock with a market capitalization of UK£988m. While investors primarily focus on the growth potential and competitive landscape of the small-cap companies, they end up ignoring a key aspect, which could be the biggest threat to its existence: its financial health. Why is it important? Evaluating financial health as part of your investment thesis is crucial, as mismanagement of capital can lead to bankruptcies, which occur at a higher rate for small-caps. We'll look at some basic checks that can form a snapshot the company’s financial strength. Nevertheless, this is just a partial view of the stock, and I recommend you dig deeper yourself into FSJ here.
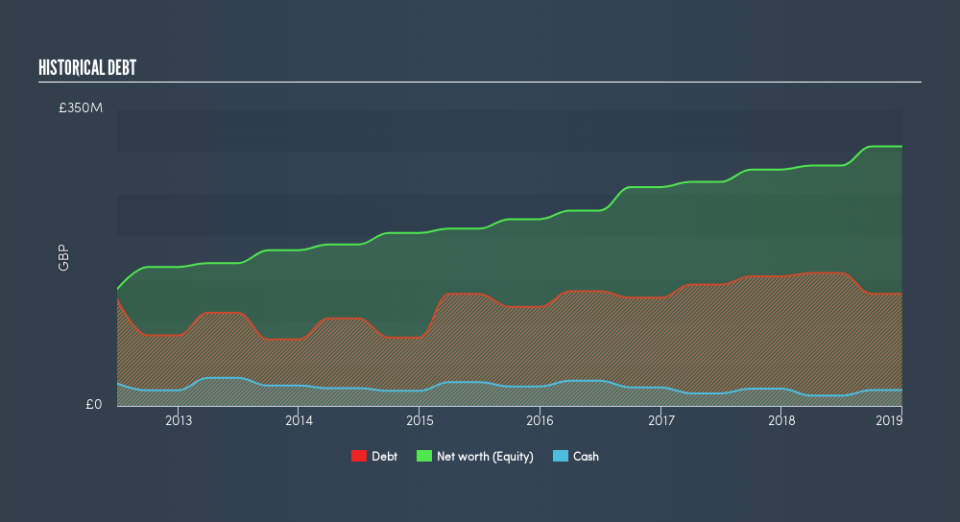
Does FSJ Produce Much Cash Relative To Its Debt?
FSJ's debt levels have fallen from UK£153m to UK£132m over the last 12 months , which includes long-term debt. With this debt payback, FSJ's cash and short-term investments stands at UK£19m , ready to be used for running the business. Additionally, FSJ has produced UK£87m in operating cash flow in the last twelve months, leading to an operating cash to total debt ratio of 66%, meaning that FSJ’s current level of operating cash is high enough to cover debt.
Can FSJ pay its short-term liabilities?
With current liabilities at UK£154m, the company has maintained a safe level of current assets to meet its obligations, with the current ratio last standing at 1.63x. The current ratio is calculated by dividing current assets by current liabilities. For Infrastructure companies, this ratio is within a sensible range as there's enough of a cash buffer without holding too much capital in low return investments.
Is FSJ’s debt level acceptable?
With a debt-to-equity ratio of 43%, FSJ can be considered as an above-average leveraged company. This is somewhat unusual for small-caps companies, since lenders are often hesitant to provide attractive interest rates to less-established businesses. We can test if FSJ’s debt levels are sustainable by measuring interest payments against earnings of a company. Ideally, earnings before interest and tax (EBIT) should cover net interest by at least three times. For FSJ, the ratio of 11.48x suggests that interest is comfortably covered, which means that lenders may be willing to lend out more funding as FSJ’s high interest coverage is seen as responsible and safe practice.
Next Steps:
Although FSJ’s debt level is towards the higher end of the spectrum, its cash flow coverage seems adequate to meet obligations which means its debt is being efficiently utilised. This may mean this is an optimal capital structure for the business, given that it is also meeting its short-term commitment. I admit this is a fairly basic analysis for FSJ's financial health. Other important fundamentals need to be considered alongside. You should continue to research James Fisher and Sons to get a better picture of the small-cap by looking at:
Future Outlook: What are well-informed industry analysts predicting for FSJ’s future growth? Take a look at our free research report of analyst consensus for FSJ’s outlook.
Valuation: What is FSJ worth today? Is the stock undervalued, even when its growth outlook is factored into its intrinsic value? The intrinsic value infographic in our free research report helps visualize whether FSJ is currently mispriced by the market.
Other High-Performing Stocks: Are there other stocks that provide better prospects with proven track records? Explore our free list of these great stocks here.
We aim to bring you long-term focused research analysis driven by fundamental data. Note that our analysis may not factor in the latest price-sensitive company announcements or qualitative material.
If you spot an error that warrants correction, please contact the editor at editorial-team@simplywallst.com. This article by Simply Wall St is general in nature. It does not constitute a recommendation to buy or sell any stock, and does not take account of your objectives, or your financial situation. Simply Wall St has no position in the stocks mentioned. Thank you for reading.
