
 Yahoo Finance
 James Halstead And 2 Other Top UK Dividend Stocks
As the UK economy shows signs of resilience with positive GDP figures and a buoyant FTSE 100, investors are keenly observing market dynamics and potential opportunities. In this context, understanding what constitutes a robust dividend stock becomes crucial, especially considering the current economic backdrop and investor sentiment towards steady income streams in uncertain times.
Top 10 Dividend Stocks In The United Kingdom
Name | Dividend Yield | Dividend Rating |
James Latham (AIM:LTHM) | 5.94% | ★★★★★★ |
Impax Asset Management Group (AIM:IPX) | 7.42% | ★★★★★☆ |
Big Yellow Group (LSE:BYG) | 3.82% | ★★★★★☆ |
Keller Group (LSE:KLR) | 3.36% | ★★★★★☆ |
Plus500 (LSE:PLUS) | 5.89% | ★★★★★☆ |
DCC (LSE:DCC) | 3.45% | ★★★★★☆ |
Rio Tinto Group (LSE:RIO) | 6.29% | ★★★★★☆ |
Grafton Group (LSE:GFTU) | 3.69% | ★★★★★☆ |
NWF Group (AIM:NWF) | 4.66% | ★★★★★☆ |
Hargreaves Services (AIM:HSP) | 6.55% | ★★★★★☆ |
Click here to see the full list of 56 stocks from our Top UK Dividend Stocks screener.
Let's explore several standout options from the results in the screener.
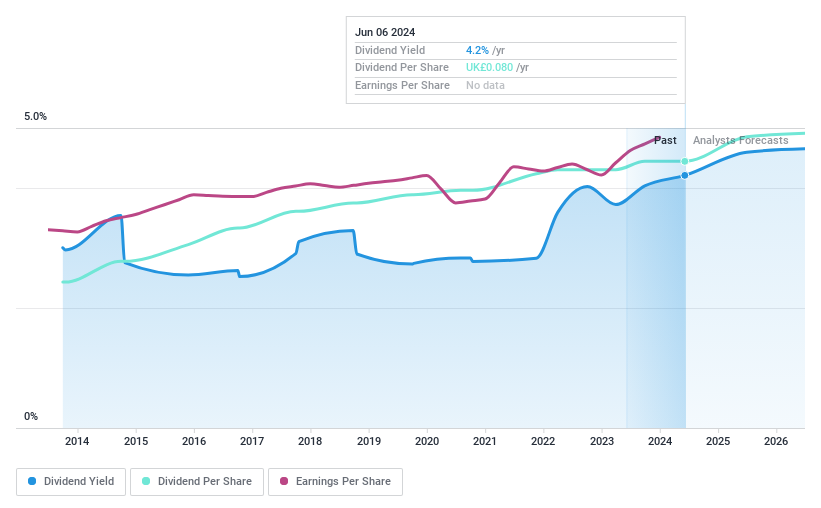
James Halstead
Simply Wall St Dividend Rating: ★★★★★☆
Overview: James Halstead plc is a UK-based manufacturer and supplier of flooring products for both commercial and domestic applications globally, with a market capitalization of approximately £0.76 billion.
Operations: James Halstead plc generates £290.38 million in revenue from the manufacture and distribution of flooring products.
Dividend Yield: 4.4%
James Halstead has demonstrated a consistent ability to cover and grow its dividends, maintaining a stable dividend per share over the past decade. The company's earnings have supported these payments with a payout ratio of 77.4%, complemented by a cash payout ratio of 62.8%. Despite trading at 59.8% below estimated fair value, its dividend yield of 4.37% remains modest compared to the UK market's top payers. Revenue growth is projected at 4.16% annually, reinforcing the sustainability of future dividends.
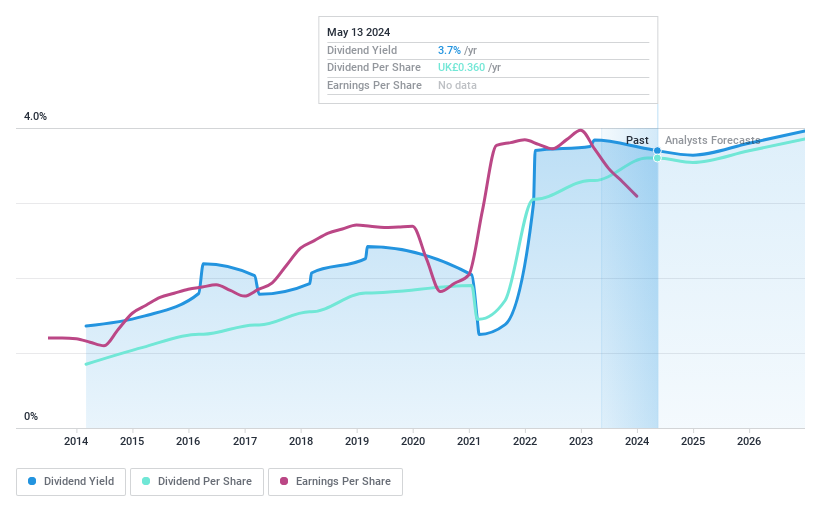
Grafton Group
Simply Wall St Dividend Rating: ★★★★★☆
Overview: Grafton Group plc operates in distribution, retailing, and manufacturing across Ireland, the Netherlands, Finland, and the United Kingdom, with a market capitalization of approximately £1.95 billion.
Operations: Grafton Group plc generates revenue through retailing (£258.20 million), manufacturing (£135.30 million), and distribution activities in the UK (£818.11 million), Ireland (£631.03 million), Finland (£139.78 million), and the Netherlands (£351.47 million).
Dividend Yield: 3.7%
Grafton Group's recent approval of a 26.0 pence final dividend reflects its ongoing commitment to shareholder returns, despite a 5.0% revenue decline to £669.2 million in early 2024. The company maintains a sustainable dividend policy with a payout ratio of 51.8% and cash payout ratio of 32.7%, ensuring dividends are well covered by earnings and cash flows alike. However, its yield of 3.69% lags behind the top UK dividend payers, indicating potential for improvement in attractiveness to income-focused investors.
Delve into the full analysis dividend report here for a deeper understanding of Grafton Group.
Our valuation report unveils the possibility Grafton Group's shares may be trading at a discount.
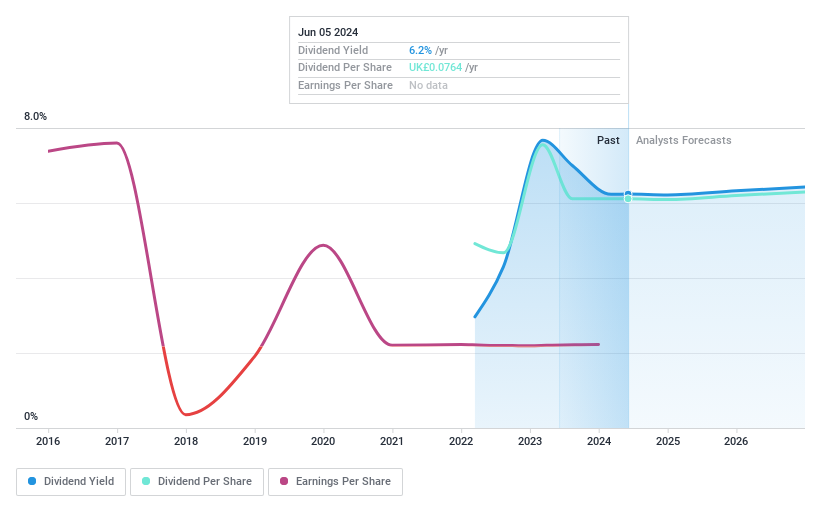
Stelrad Group
Simply Wall St Dividend Rating: ★★★★☆☆
Overview: Stelrad Group PLC is a company that manufactures and distributes radiators across the United Kingdom, Ireland, Europe, Turkey, and other international markets, with a market capitalization of approximately £150.28 million.
Operations: Stelrad Group PLC generates £308.19 million from its core business of radiator manufacturing and distribution.
Dividend Yield: 6.5%
Stelrad Group PLC has demonstrated a mixed performance in its dividend offerings, with an increased but unstable dividend history over just two years. The company's payout ratio stands at 63.1%, suggesting dividends are reasonably covered by earnings, complemented by a robust cash payout ratio of 36.7%. Despite trading 42.5% below estimated fair value and offering a competitive yield of 6.47%, recent executive changes raise concerns about potential impacts on future financial stability and dividend reliability.
Click here to discover the nuances of Stelrad Group with our detailed analytical dividend report.
Our valuation report here indicates Stelrad Group may be undervalued.
Where To Now?
Access the full spectrum of 56 Top UK Dividend Stocks by clicking on this link.
Are any of these part of your asset mix? Tap into the analytical power of Simply Wall St's portfolio to get a 360-degree view on how they're shaping up.
Join a community of smart investors by using Simply Wall St. It's free and delivers expert-level analysis on worldwide markets.
Curious About Other Options?
Explore high-performing small cap companies that haven't yet garnered significant analyst attention.
Fuel your portfolio with companies showing strong growth potential, backed by optimistic outlooks both from analysts and management.
Find companies with promising cash flow potential yet trading below their fair value.
This article by Simply Wall St is general in nature. We provide commentary based on historical data and analyst forecasts only using an unbiased methodology and our articles are not intended to be financial advice. It does not constitute a recommendation to buy or sell any stock, and does not take account of your objectives, or your financial situation. We aim to bring you long-term focused analysis driven by fundamental data. Note that our analysis may not factor in the latest price-sensitive company announcements or qualitative material. Simply Wall St has no position in any stocks mentioned.
Companies discussed in this article include AIM:JHD LSE:GFTU and LSE:SRAD.
Have feedback on this article? Concerned about the content? Get in touch with us directly. Alternatively, email editorial-team@simplywallst.com
