
 Yahoo Finance
 Here’s What James Halstead plc’s (LON:JHD) ROCE Can Tell Us

Today we’ll evaluate James Halstead plc (LON:JHD) to determine whether it could have potential as an investment idea. Specifically, we’re going to calculate its Return On Capital Employed (ROCE), in the hopes of getting some insight into the business.
First, we’ll go over how we calculate ROCE. Then we’ll compare its ROCE to similar companies. And finally, we’ll look at how its current liabilities are impacting its ROCE.
What is Return On Capital Employed (ROCE)?
ROCE is a measure of a company’s yearly pre-tax profit (its return), relative to the capital employed in the business. All else being equal, a better business will have a higher ROCE. Ultimately, it is a useful but imperfect metric. Author Edwin Whiting says to be careful when comparing the ROCE of different businesses, since ‘No two businesses are exactly alike.’
So, How Do We Calculate ROCE?
Analysts use this formula to calculate return on capital employed:
Return on Capital Employed = Earnings Before Interest and Tax (EBIT) ÷ (Total Assets – Current Liabilities)
Or for James Halstead:
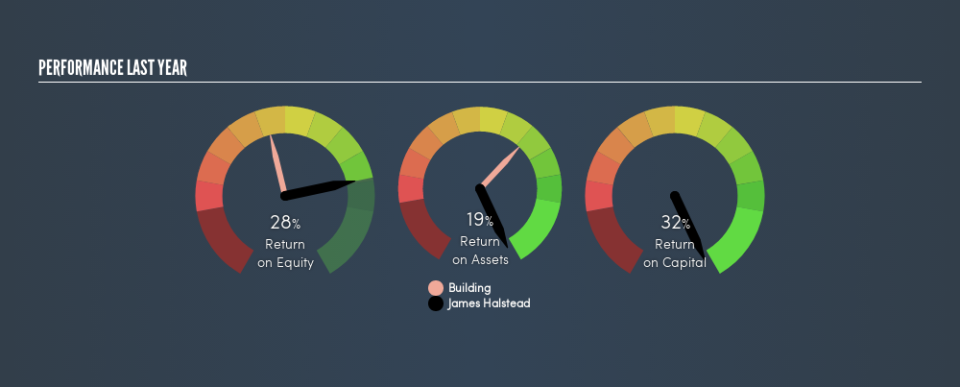
0.32 = UK£47m ÷ (UK£197m – UK£53m) (Based on the trailing twelve months to June 2018.)
So, James Halstead has an ROCE of 32%.
See our latest analysis for James Halstead
Does James Halstead Have A Good ROCE?
ROCE is commonly used for comparing the performance of similar businesses. In our analysis, James Halstead’s ROCE is meaningfully higher than the 11% average in the Building industry. We would consider this a positive, as it suggests it is using capital more effectively than other similar companies. Putting aside its position relative to its industry for now, in absolute terms, James Halstead’s ROCE is currently very good.
It is important to remember that ROCE shows past performance, and is not necessarily predictive. Companies in cyclical industries can be difficult to understand using ROCE, as returns typically look high during boom times, and low during busts. ROCE is, after all, simply a snap shot of a single year. Future performance is what matters, and you can see analyst predictions in our free report on analyst forecasts for the company.
Do James Halstead’s Current Liabilities Skew Its ROCE?
Current liabilities are short term bills and invoices that need to be paid in 12 months or less. Due to the way the ROCE equation works, having large bills due in the near term can make it look as though a company has less capital employed, and thus a higher ROCE than usual. To check the impact of this, we calculate if a company has high current liabilities relative to its total assets.
James Halstead has total assets of UK£197m and current liabilities of UK£53m. As a result, its current liabilities are equal to approximately 27% of its total assets. This is quite a low level of current liabilities which would not greatly boost the already high ROCE.
The Bottom Line On James Halstead’s ROCE
With low current liabilities and a high ROCE, James Halstead could be worthy of further investigation. Of course you might be able to find a better stock than James Halstead. So you may wish to see this free collection of other companies that have grown earnings strongly.
For those who like to find winning investments this free list of growing companies with recent insider purchasing, could be just the ticket.
We aim to bring you long-term focused research analysis driven by fundamental data. Note that our analysis may not factor in the latest price-sensitive company announcements or qualitative material.
If you spot an error that warrants correction, please contact the editor at editorial-team@simplywallst.com. This article by Simply Wall St is general in nature. It does not constitute a recommendation to buy or sell any stock, and does not take account of your objectives, or your financial situation. Simply Wall St has no position in the stocks mentioned. Thank you for reading.
