
 Yahoo Finance
 James Latham (LON:LTHM) Has More To Do To Multiply In Value Going Forward
If we want to find a potential multi-bagger, often there are underlying trends that can provide clues. In a perfect world, we'd like to see a company investing more capital into its business and ideally the returns earned from that capital are also increasing. This shows us that it's a compounding machine, able to continually reinvest its earnings back into the business and generate higher returns. That's why when we briefly looked at James Latham's (LON:LTHM) ROCE trend, we were pretty happy with what we saw.
What Is Return On Capital Employed (ROCE)?
For those who don't know, ROCE is a measure of a company's yearly pre-tax profit (its return), relative to the capital employed in the business. The formula for this calculation on James Latham is:
Return on Capital Employed = Earnings Before Interest and Tax (EBIT) ÷ (Total Assets - Current Liabilities)
0.16 = UK£35m ÷ (UK£253m - UK£36m) (Based on the trailing twelve months to September 2023).
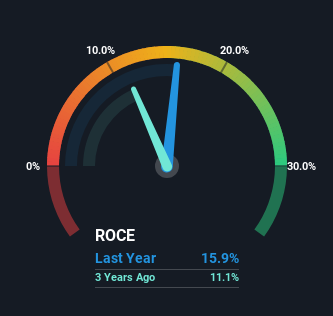
Therefore, James Latham has an ROCE of 16%. In absolute terms, that's a pretty normal return, and it's somewhat close to the Trade Distributors industry average of 14%.
Check out our latest analysis for James Latham
In the above chart we have measured James Latham's prior ROCE against its prior performance, but the future is arguably more important. If you're interested, you can view the analysts predictions in our free report on analyst forecasts for the company.
How Are Returns Trending?
The trend of ROCE doesn't stand out much, but returns on a whole are decent. Over the past five years, ROCE has remained relatively flat at around 16% and the business has deployed 107% more capital into its operations. Since 16% is a moderate ROCE though, it's good to see a business can continue to reinvest at these decent rates of return. Over long periods of time, returns like these might not be too exciting, but with consistency they can pay off in terms of share price returns.
The Bottom Line On James Latham's ROCE
The main thing to remember is that James Latham has proven its ability to continually reinvest at respectable rates of return. And long term investors would be thrilled with the 109% return they've received over the last five years. So even though the stock might be more "expensive" than it was before, we think the strong fundamentals warrant this stock for further research.
One more thing to note, we've identified 1 warning sign with James Latham and understanding this should be part of your investment process.
While James Latham may not currently earn the highest returns, we've compiled a list of companies that currently earn more than 25% return on equity. Check out this free list here.
Have feedback on this article? Concerned about the content? Get in touch with us directly. Alternatively, email editorial-team (at) simplywallst.com.
This article by Simply Wall St is general in nature. We provide commentary based on historical data and analyst forecasts only using an unbiased methodology and our articles are not intended to be financial advice. It does not constitute a recommendation to buy or sell any stock, and does not take account of your objectives, or your financial situation. We aim to bring you long-term focused analysis driven by fundamental data. Note that our analysis may not factor in the latest price-sensitive company announcements or qualitative material. Simply Wall St has no position in any stocks mentioned.
