
 Yahoo Finance
 Jarvis Securities (LON:JIM) shareholders have endured a 19% loss from investing in the stock a year ago
It's easy to match the overall market return by buying an index fund. But if you buy individual stocks, you can do both better or worse than that. Unfortunately the Jarvis Securities plc (LON:JIM) share price slid 25% over twelve months. That falls noticeably short of the market decline of around 3.7%. Longer term shareholders haven't suffered as badly, since the stock is down a comparatively less painful 0.6% in three years.
With that in mind, it's worth seeing if the company's underlying fundamentals have been the driver of long term performance, or if there are some discrepancies.
View our latest analysis for Jarvis Securities
To paraphrase Benjamin Graham: Over the short term the market is a voting machine, but over the long term it's a weighing machine. One way to examine how market sentiment has changed over time is to look at the interaction between a company's share price and its earnings per share (EPS).
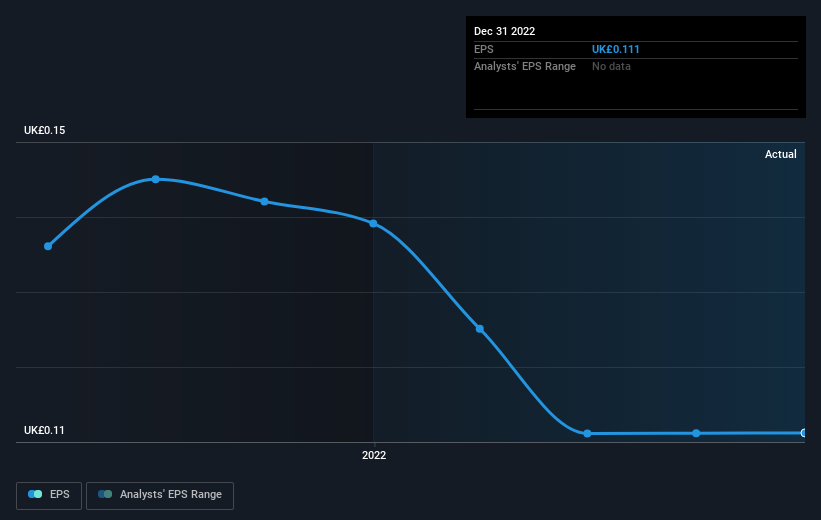
Unfortunately Jarvis Securities reported an EPS drop of 20% for the last year. We note that the 25% share price drop is very close to the EPS drop. Given the lower EPS we might have expected investors to lose confidence in the stock, but that doesn't seemed to have happened. Instead, the change in the share price seems to reduction in earnings per share, alone.
You can see below how EPS has changed over time (discover the exact values by clicking on the image).
This free interactive report on Jarvis Securities' earnings, revenue and cash flow is a great place to start, if you want to investigate the stock further.
What About Dividends?
As well as measuring the share price return, investors should also consider the total shareholder return (TSR). Whereas the share price return only reflects the change in the share price, the TSR includes the value of dividends (assuming they were reinvested) and the benefit of any discounted capital raising or spin-off. It's fair to say that the TSR gives a more complete picture for stocks that pay a dividend. In the case of Jarvis Securities, it has a TSR of -19% for the last 1 year. That exceeds its share price return that we previously mentioned. The dividends paid by the company have thusly boosted the total shareholder return.
A Different Perspective
Investors in Jarvis Securities had a tough year, with a total loss of 19% (including dividends), against a market gain of about 3.7%. However, keep in mind that even the best stocks will sometimes underperform the market over a twelve month period. Longer term investors wouldn't be so upset, since they would have made 12%, each year, over five years. It could be that the recent sell-off is an opportunity, so it may be worth checking the fundamental data for signs of a long term growth trend. While it is well worth considering the different impacts that market conditions can have on the share price, there are other factors that are even more important. Consider for instance, the ever-present spectre of investment risk. We've identified 2 warning signs with Jarvis Securities , and understanding them should be part of your investment process.
We will like Jarvis Securities better if we see some big insider buys. While we wait, check out this free list of growing companies with considerable, recent, insider buying.
Please note, the market returns quoted in this article reflect the market weighted average returns of stocks that currently trade on British exchanges.
Have feedback on this article? Concerned about the content? Get in touch with us directly. Alternatively, email editorial-team (at) simplywallst.com.
This article by Simply Wall St is general in nature. We provide commentary based on historical data and analyst forecasts only using an unbiased methodology and our articles are not intended to be financial advice. It does not constitute a recommendation to buy or sell any stock, and does not take account of your objectives, or your financial situation. We aim to bring you long-term focused analysis driven by fundamental data. Note that our analysis may not factor in the latest price-sensitive company announcements or qualitative material. Simply Wall St has no position in any stocks mentioned.
Join A Paid User Research Session
You’ll receive a US$30 Amazon Gift card for 1 hour of your time while helping us build better investing tools for the individual investors like yourself. Sign up here
