
 Yahoo Finance
 JD.com (NASDAQ:JD) pulls back 3.8% this week, but still delivers shareholders notable 21% CAGR over 3 years
It hasn't been the best quarter for JD.com, Inc. (NASDAQ:JD) shareholders, since the share price has fallen 24% in that time. But that doesn't change the fact that the returns over the last three years have been pleasing. In fact, the company's share price bested the return of its market index in that time, posting a gain of 74%.
While this past week has detracted from the company's three-year return, let's look at the recent trends of the underlying business and see if the gains have been in alignment.
View our latest analysis for JD.com
There is no denying that markets are sometimes efficient, but prices do not always reflect underlying business performance. By comparing earnings per share (EPS) and share price changes over time, we can get a feel for how investor attitudes to a company have morphed over time.
During the three years of share price growth, JD.com actually saw its earnings per share (EPS) drop 11% per year. In this instance, recent extraordinary items impacted the earnings.
Thus, it seems unlikely that the market is focussed on EPS growth at the moment. Given this situation, it makes sense to look at other metrics too.
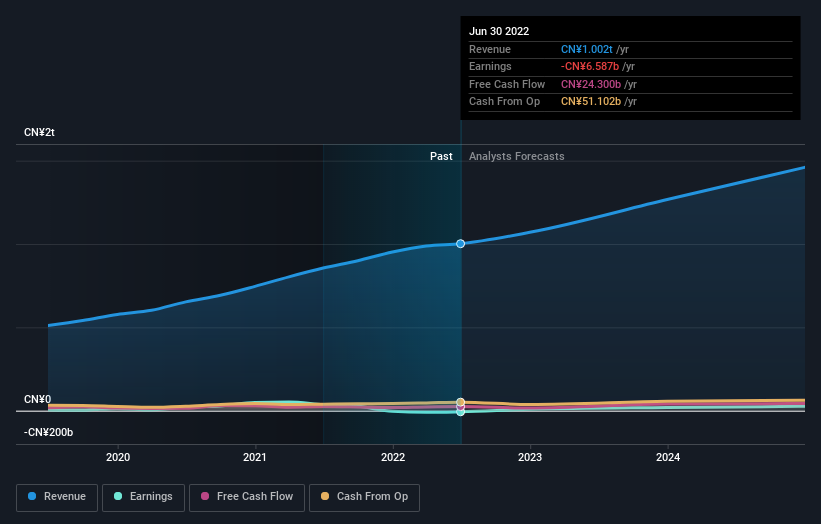
It could be that the revenue growth of 24% per year is viewed as evidence that JD.com is growing. If the company is being managed for the long term good, today's shareholders might be right to hold on.
The image below shows how earnings and revenue have tracked over time (if you click on the image you can see greater detail).
JD.com is a well known stock, with plenty of analyst coverage, suggesting some visibility into future growth. You can see what analysts are predicting for JD.com in this interactive graph of future profit estimates.
What About The Total Shareholder Return (TSR)?
Investors should note that there's a difference between JD.com's total shareholder return (TSR) and its share price change, which we've covered above. The TSR is a return calculation that accounts for the value of cash dividends (assuming that any dividend received was reinvested) and the calculated value of any discounted capital raisings and spin-offs. JD.com hasn't been paying dividends, but its TSR of 78% exceeds its share price return of 74%, implying it has either spun-off a business, or raised capital at a discount; thereby providing additional value to shareholders.
A Different Perspective
While the broader market lost about 22% in the twelve months, JD.com shareholders did even worse, losing 26%. However, it could simply be that the share price has been impacted by broader market jitters. It might be worth keeping an eye on the fundamentals, in case there's a good opportunity. Longer term investors wouldn't be so upset, since they would have made 6%, each year, over five years. If the fundamental data continues to indicate long term sustainable growth, the current sell-off could be an opportunity worth considering. You could get a better understanding of JD.com's growth by checking out this more detailed historical graph of earnings, revenue and cash flow.
Of course, you might find a fantastic investment by looking elsewhere. So take a peek at this free list of companies we expect will grow earnings.
Please note, the market returns quoted in this article reflect the market weighted average returns of stocks that currently trade on US exchanges.
Have feedback on this article? Concerned about the content? Get in touch with us directly. Alternatively, email editorial-team (at) simplywallst.com.
This article by Simply Wall St is general in nature. We provide commentary based on historical data and analyst forecasts only using an unbiased methodology and our articles are not intended to be financial advice. It does not constitute a recommendation to buy or sell any stock, and does not take account of your objectives, or your financial situation. We aim to bring you long-term focused analysis driven by fundamental data. Note that our analysis may not factor in the latest price-sensitive company announcements or qualitative material. Simply Wall St has no position in any stocks mentioned.
Join A Paid User Research Session
You’ll receive a US$30 Amazon Gift card for 1 hour of your time while helping us build better investing tools for the individual investors like yourself. Sign up here
