
 Yahoo Finance
 JD.com (NASDAQ:JD shareholders incur further losses as stock declines 5.5% this week, taking one-year losses to 40%
The simplest way to benefit from a rising market is to buy an index fund. Active investors aim to buy stocks that vastly outperform the market - but in the process, they risk under-performance. Unfortunately the JD.com, Inc. (NASDAQ:JD) share price slid 41% over twelve months. That's well below the market decline of 1.0%. We note that it has not been easy for shareholders over three years, either; the share price is down 40% in that time. The falls have accelerated recently, with the share price down 28% in the last three months. This could be related to the recent financial results - you can catch up on the most recent data by reading our company report.
With the stock having lost 5.5% in the past week, it's worth taking a look at business performance and seeing if there's any red flags.
See our latest analysis for JD.com
In his essay The Superinvestors of Graham-and-Doddsville Warren Buffett described how share prices do not always rationally reflect the value of a business. One flawed but reasonable way to assess how sentiment around a company has changed is to compare the earnings per share (EPS) with the share price.
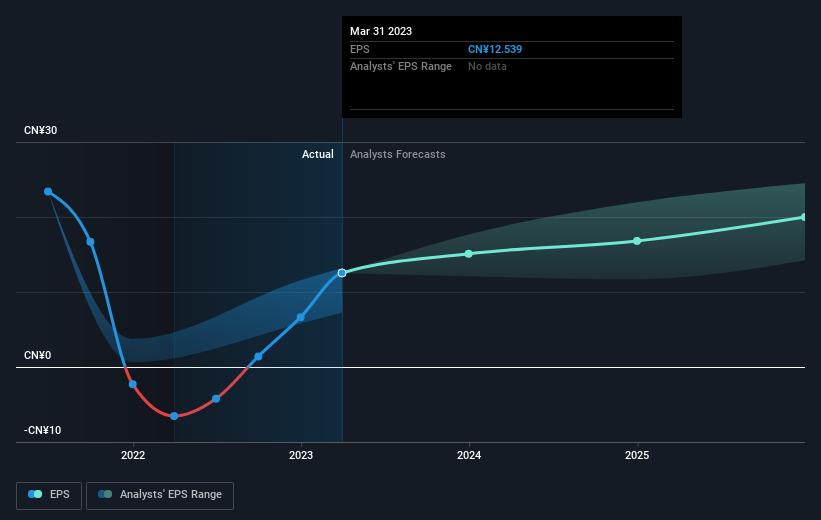
JD.com managed to increase earnings per share from a loss to a profit, over the last 12 months.
The result looks like a strong improvement to us, so we're surprised the market has sold down the shares. If the improved profitability is a sign of things to come, then right now may prove the perfect time to pop this stock on your watchlist.
You can see how EPS has changed over time in the image below (click on the chart to see the exact values).
We know that JD.com has improved its bottom line over the last three years, but what does the future have in store? It might be well worthwhile taking a look at our free report on how its financial position has changed over time.
A Different Perspective
While the broader market gained around 1.0% in the last year, JD.com shareholders lost 40% (even including dividends). Even the share prices of good stocks drop sometimes, but we want to see improvements in the fundamental metrics of a business, before getting too interested. Unfortunately, last year's performance may indicate unresolved challenges, given that it was worse than the annualised loss of 2% over the last half decade. Generally speaking long term share price weakness can be a bad sign, though contrarian investors might want to research the stock in hope of a turnaround. It's always interesting to track share price performance over the longer term. But to understand JD.com better, we need to consider many other factors. Case in point: We've spotted 2 warning signs for JD.com you should be aware of.
Of course JD.com may not be the best stock to buy. So you may wish to see this free collection of growth stocks.
Please note, the market returns quoted in this article reflect the market weighted average returns of stocks that currently trade on American exchanges.
Have feedback on this article? Concerned about the content? Get in touch with us directly. Alternatively, email editorial-team (at) simplywallst.com.
This article by Simply Wall St is general in nature. We provide commentary based on historical data and analyst forecasts only using an unbiased methodology and our articles are not intended to be financial advice. It does not constitute a recommendation to buy or sell any stock, and does not take account of your objectives, or your financial situation. We aim to bring you long-term focused analysis driven by fundamental data. Note that our analysis may not factor in the latest price-sensitive company announcements or qualitative material. Simply Wall St has no position in any stocks mentioned.
Join A Paid User Research Session
You’ll receive a US$30 Amazon Gift card for 1 hour of your time while helping us build better investing tools for the individual investors like yourself. Sign up here
