
 Yahoo Finance
 JDE Peet's N.V. (AMS:JDEP) Investors Are Less Pessimistic Than Expected
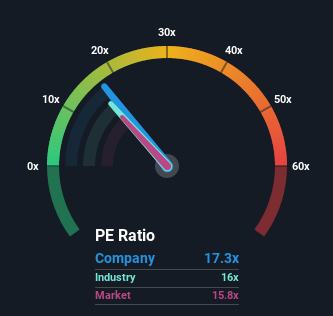
It's not a stretch to say that JDE Peet's N.V.'s (AMS:JDEP) price-to-earnings (or "P/E") ratio of 17.3x right now seems quite "middle-of-the-road" compared to the market in the Netherlands, where the median P/E ratio is around 16x. While this might not raise any eyebrows, if the P/E ratio is not justified investors could be missing out on a potential opportunity or ignoring looming disappointment.
Recent times haven't been advantageous for JDE Peet's as its earnings have been rising slower than most other companies. One possibility is that the P/E is moderate because investors think this lacklustre earnings performance will turn around. You'd really hope so, otherwise you're paying a relatively elevated price for a company with this sort of growth profile.
See our latest analysis for JDE Peet's
Want the full picture on analyst estimates for the company? Then our free report on JDE Peet's will help you uncover what's on the horizon.
Does Growth Match The P/E?
In order to justify its P/E ratio, JDE Peet's would need to produce growth that's similar to the market.
Retrospectively, the last year delivered a decent 2.9% gain to the company's bottom line. However, this wasn't enough as the latest three year period has seen an unpleasant 17% overall drop in EPS. Accordingly, shareholders would have felt downbeat about the medium-term rates of earnings growth.
Shifting to the future, estimates from the analysts covering the company suggest earnings should grow by 4.8% per annum over the next three years. With the market predicted to deliver 11% growth per year, the company is positioned for a weaker earnings result.
With this information, we find it interesting that JDE Peet's is trading at a fairly similar P/E to the market. Apparently many investors in the company are less bearish than analysts indicate and aren't willing to let go of their stock right now. These shareholders may be setting themselves up for future disappointment if the P/E falls to levels more in line with the growth outlook.
What We Can Learn From JDE Peet's' P/E?
Using the price-to-earnings ratio alone to determine if you should sell your stock isn't sensible, however it can be a practical guide to the company's future prospects.
We've established that JDE Peet's currently trades on a higher than expected P/E since its forecast growth is lower than the wider market. Right now we are uncomfortable with the P/E as the predicted future earnings aren't likely to support a more positive sentiment for long. Unless these conditions improve, it's challenging to accept these prices as being reasonable.
We don't want to rain on the parade too much, but we did also find 1 warning sign for JDE Peet's that you need to be mindful of.
It's important to make sure you look for a great company, not just the first idea you come across. So take a peek at this free list of interesting companies with strong recent earnings growth (and a P/E ratio below 20x).
Have feedback on this article? Concerned about the content? Get in touch with us directly. Alternatively, email editorial-team (at) simplywallst.com.
This article by Simply Wall St is general in nature. We provide commentary based on historical data and analyst forecasts only using an unbiased methodology and our articles are not intended to be financial advice. It does not constitute a recommendation to buy or sell any stock, and does not take account of your objectives, or your financial situation. We aim to bring you long-term focused analysis driven by fundamental data. Note that our analysis may not factor in the latest price-sensitive company announcements or qualitative material. Simply Wall St has no position in any stocks mentioned.
Join A Paid User Research Session
You’ll receive a US$30 Amazon Gift card for 1 hour of your time while helping us build better investing tools for the individual investors like yourself. Sign up here
