
 Yahoo Finance
 Jobless America: the coronavirus unemployment crisis in figures
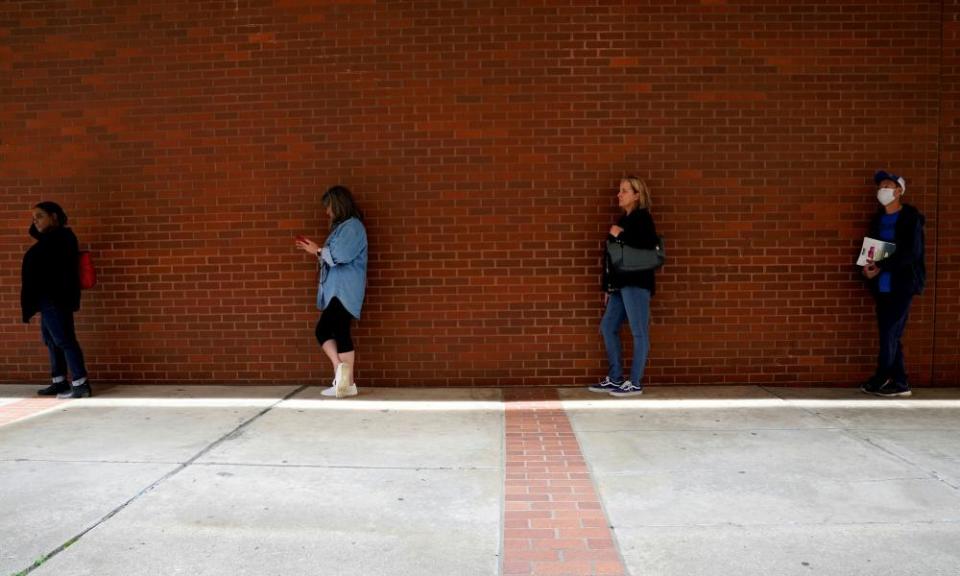
More than 40 million Americans have filed for unemployment over the last 10 weeks – a number of jobless the US has not seen since the Great Depression.
Related: US job losses hit 40m as coronavirus crisis sees claims rise 2.1m in a week
The economic impacts of Covid-19 have been far and wide, hurting virtually every industry and leaving tens of millions of people without paychecks to pay the bills.
Here are the key numbers that tell the story of the masses of unemployed workers and the devastating economic impact the crisis has had.
1. The national unemployment rate: 14.7%
The Department of Labor releases the latest national unemployment rate at the beginning of each month. In the figures for April, which was released earlier in May, the rate was 14.7%, up from 4.4% in March. While many states have begun gradual reopening processes, the figure only represents those whose claims were filed up until mid-April. Millions more have filed claims since then, though we will not know how that has affected the unemployment rate until May’s figures are released in early June.
2. The black and Hispanic unemployment rates: 16.7% and 18.9%
Economists have long known that black and Hispanic Americans are the most vulnerable during economic recessions, and while many workers of color are in essential jobs, the Covid-19 economic crisis has proved no different. Even at its lowest, the black unemployment rate is typically double that of white unemployment, with Hispanic unemployment not too far behind. Experts say job segregation pushes black and Hispanic workers into low-paying industries, like hospitality, that come with little to no benefits and have been hit hardest.
3. Percentage of unemployed Americans who are women: 55%
Though women make up a smaller percentage of the working population, a slight majority of people who were laid off in the last few months are women. At the beginning of May, the Department of Labor reported nearly 11.5 million women had lost jobs, compared with about 11 million men. This is no coincidence given that the industries that have been hardest-hit by shutdown orders, hospitality and leisure, education and healthcare, employ more women than others.
4. The leisure and hospitality unemployment rate: 39.8%
Last month’s Department of Labor figures confirmed that the leisure and hospitality industry has been the hardest-hit by the economic downturn. About 4.8 million workers, the highest of any industry have lost their jobs in the industry.
5. State with the highest unemployment rate: Nevada
Nevada’s unemployment rate is the highest of any state at 28.2%, meaning one in four people in the state of 3 million was unemployed in April. Nevada’s economy relies heavily on tourism, which brought in $67.6bn in 2018. Michigan and Hawaii had the second and third highest rates with 22.7% and 22.3% unemployment, respectively.
6. Average unemployment insurance benefit amount: about $980
Pre-pandemic, the average unemployment insurance check was about $380. But because each state is in charge of its own unemployment system, and sets the amount that is given in unemployment insurance, it varies widely. Some states give about a fifth of a person’s paycheck while others give half or more. To compensate for the widespread differences, those who successfully file for unemployment are given an extra $600 a week through the end of July with money Congress set aside in its massive coronavirus stimulus package in March. While this means some are still barely making ends meet, others are getting more than they were getting in the jobs they were laid off from.
7. Highest number of unemployment claims in one week: 6.6m
Between 29 March and 4 April, 6.6 million Americans filed for unemployment, a staggering number that signaled the true depths of the economic crisis.
8. Number of households deemed food insecure: 1 in 5
An analysis by the Brookings Institution found one in five households in the US were deemed food insecure by the end of April. Food banks have seen shortages in light of increased demand as millions of families struggle to pay for groceries. The analysis found the situation is worse for families with children: two in five households with mothers and children under the age of 12 are food insecure.
9. Number of gig workers unemployed: more than 6.1m
In its latest stimulus package, Congress included a federal program that allows self-employed workers and contractors to receive unemployment benefits. In its unemployment report last week, the Department of Labor said that 6.1 million Americans who classify as self-employed were receiving unemployment insurance.
10. Percentage of low-wage workers unemployed: 40%
In remarks given on 13 May, the Federal Reserve chair, Jerome Powell, delivered a shocking statistic from a Fed survey: 40% of households making under $40,000 a year lost a job in March. “This reversal of economic fortune has caused a level of pain that is hard to capture in words,” Powell said.
