
 Yahoo Finance
 What Is John Menzies's (LON:MNZS) P/E Ratio After Its Share Price Tanked?

To the annoyance of some shareholders, John Menzies (LON:MNZS) shares are down a considerable 79% in the last month. Given the 82% drop over the last year, some shareholders might be worried that they have become bagholders. What is a bagholder? It is a shareholder who has suffered a bad loss, but continues to hold indefinitely, without questioning their reasons for holding, even as the losses grow greater.
Assuming nothing else has changed, a lower share price makes a stock more attractive to potential buyers. In the long term, share prices tend to follow earnings per share, but in the short term prices bounce around in response to short term factors (which are not always obvious). The implication here is that long term investors have an opportunity when expectations of a company are too low. One way to gauge market expectations of a stock is to look at its Price to Earnings Ratio (PE Ratio). A high P/E implies that investors have high expectations of what a company can achieve compared to a company with a low P/E ratio.
See our latest analysis for John Menzies
How Does John Menzies's P/E Ratio Compare To Its Peers?
We can tell from its P/E ratio of 8.05 that sentiment around John Menzies isn't particularly high. We can see in the image below that the average P/E (9.2) for companies in the infrastructure industry is higher than John Menzies's P/E.
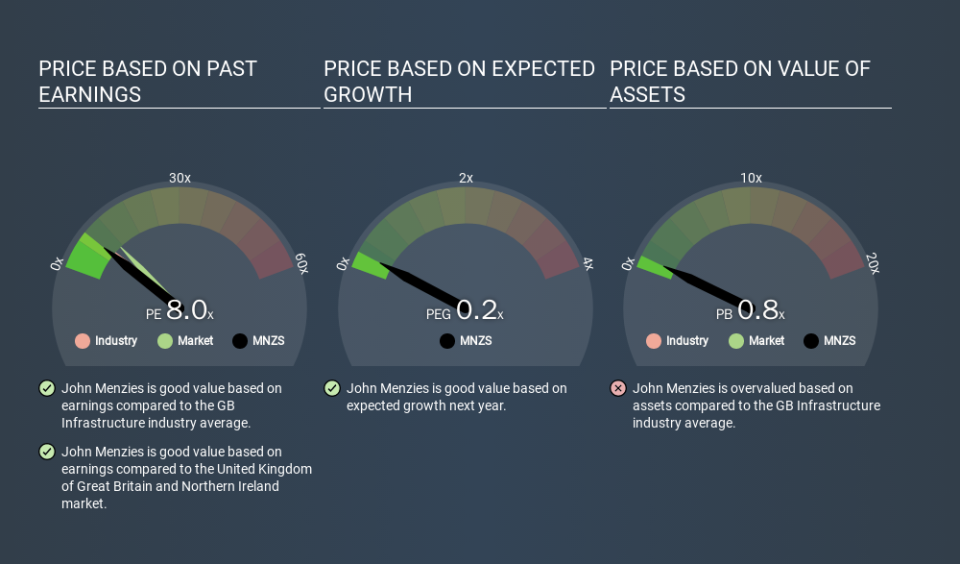
Its relatively low P/E ratio indicates that John Menzies shareholders think it will struggle to do as well as other companies in its industry classification. Since the market seems unimpressed with John Menzies, it's quite possible it could surprise on the upside. If you consider the stock interesting, further research is recommended. For example, I often monitor director buying and selling.
How Growth Rates Impact P/E Ratios
When earnings fall, the 'E' decreases, over time. That means even if the current P/E is low, it will increase over time if the share price stays flat. So while a stock may look cheap based on past earnings, it could be expensive based on future earnings.
John Menzies saw earnings per share decrease by 26% last year. And EPS is down 14% a year, over the last 5 years. This growth rate might warrant a below average P/E ratio.
A Limitation: P/E Ratios Ignore Debt and Cash In The Bank
One drawback of using a P/E ratio is that it considers market capitalization, but not the balance sheet. So it won't reflect the advantage of cash, or disadvantage of debt. Theoretically, a business can improve its earnings (and produce a lower P/E in the future) by investing in growth. That means taking on debt (or spending its cash).
Such spending might be good or bad, overall, but the key point here is that you need to look at debt to understand the P/E ratio in context.
So What Does John Menzies's Balance Sheet Tell Us?
John Menzies has net debt worth a very significant 299% of its market capitalization. This is a relatively high level of debt, so the stock probably deserves a relatively low P/E ratio. Keep that in mind when comparing it to other companies.
The Verdict On John Menzies's P/E Ratio
John Menzies's P/E is 8.0 which is below average (11.8) in the GB market. The P/E reflects market pessimism that probably arises from the lack of recent EPS growth, paired with significant leverage. What can be absolutely certain is that the market has become more pessimistic about John Menzies over the last month, with the P/E ratio falling from 37.9 back then to 8.0 today. For those who prefer invest in growth, this stock apparently offers limited promise, but the deep value investors may find the pessimism around this stock enticing.
Investors should be looking to buy stocks that the market is wrong about. If the reality for a company is not as bad as the P/E ratio indicates, then the share price should increase as the market realizes this. So this free report on the analyst consensus forecasts could help you make a master move on this stock.
Of course you might be able to find a better stock than John Menzies. So you may wish to see this free collection of other companies that have grown earnings strongly.
If you spot an error that warrants correction, please contact the editor at editorial-team@simplywallst.com. This article by Simply Wall St is general in nature. It does not constitute a recommendation to buy or sell any stock, and does not take account of your objectives, or your financial situation. Simply Wall St has no position in the stocks mentioned.
We aim to bring you long-term focused research analysis driven by fundamental data. Note that our analysis may not factor in the latest price-sensitive company announcements or qualitative material. Thank you for reading.
