
 Yahoo Finance
 John Wood Group's (LON:WG.) Stock Price Has Reduced 58% In The Past Five Years
Generally speaking long term investing is the way to go. But no-one is immune from buying too high. For example the John Wood Group PLC (LON:WG.) share price dropped 58% over five years. We certainly feel for shareholders who bought near the top. The falls have accelerated recently, with the share price down 16% in the last three months. This could be related to the recent financial results - you can catch up on the most recent data by reading our company report.
View our latest analysis for John Wood Group
There is no denying that markets are sometimes efficient, but prices do not always reflect underlying business performance. By comparing earnings per share (EPS) and share price changes over time, we can get a feel for how investor attitudes to a company have morphed over time.
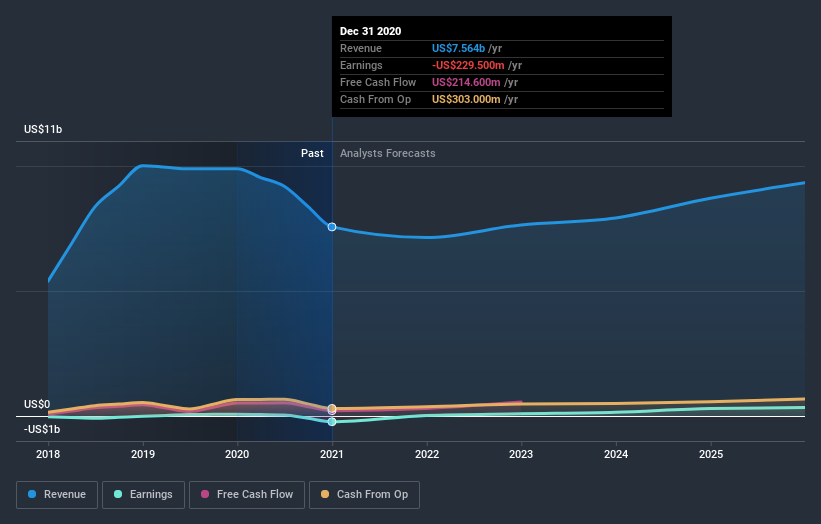
During five years of share price growth, John Wood Group moved from a loss to profitability. However, it made a loss in the last twelve months, suggesting profit may be an unreliable metric at this stage. Other metrics may better explain the share price move.
Revenue is actually up 17% over the time period. So it seems one might have to take closer look at the fundamentals to understand why the share price languishes. After all, there may be an opportunity.
The company's revenue and earnings (over time) are depicted in the image below (click to see the exact numbers).
You can see how its balance sheet has strengthened (or weakened) over time in this free interactive graphic.
What about the Total Shareholder Return (TSR)?
Investors should note that there's a difference between John Wood Group's total shareholder return (TSR) and its share price change, which we've covered above. The TSR attempts to capture the value of dividends (as if they were reinvested) as well as any spin-offs or discounted capital raisings offered to shareholders. Its history of dividend payouts mean that John Wood Group's TSR, which was a 51% drop over the last 5 years, was not as bad as the share price return.
A Different Perspective
We're pleased to report that John Wood Group shareholders have received a total shareholder return of 54% over one year. Notably the five-year annualised TSR loss of 9% per year compares very unfavourably with the recent share price performance. The long term loss makes us cautious, but the short term TSR gain certainly hints at a brighter future. While it is well worth considering the different impacts that market conditions can have on the share price, there are other factors that are even more important. Consider risks, for instance. Every company has them, and we've spotted 1 warning sign for John Wood Group you should know about.
If you are like me, then you will not want to miss this free list of growing companies that insiders are buying.
Please note, the market returns quoted in this article reflect the market weighted average returns of stocks that currently trade on GB exchanges.
This article by Simply Wall St is general in nature. It does not constitute a recommendation to buy or sell any stock, and does not take account of your objectives, or your financial situation. We aim to bring you long-term focused analysis driven by fundamental data. Note that our analysis may not factor in the latest price-sensitive company announcements or qualitative material. Simply Wall St has no position in any stocks mentioned.
Have feedback on this article? Concerned about the content? Get in touch with us directly. Alternatively, email editorial-team (at) simplywallst.com.
