
 Yahoo Finance
 Johnson Matthey (LON:JMAT) Has Some Way To Go To Become A Multi-Bagger
To find a multi-bagger stock, what are the underlying trends we should look for in a business? Firstly, we'll want to see a proven return on capital employed (ROCE) that is increasing, and secondly, an expanding base of capital employed. Ultimately, this demonstrates that it's a business that is reinvesting profits at increasing rates of return. That's why when we briefly looked at Johnson Matthey's (LON:JMAT) ROCE trend, we were pretty happy with what we saw.
Return On Capital Employed (ROCE): What is it?
For those that aren't sure what ROCE is, it measures the amount of pre-tax profits a company can generate from the capital employed in its business. The formula for this calculation on Johnson Matthey is:
Return on Capital Employed = Earnings Before Interest and Tax (EBIT) ÷ (Total Assets - Current Liabilities)
0.17 = UK£654m ÷ (UK£7.5b - UK£3.6b) (Based on the trailing twelve months to September 2021).
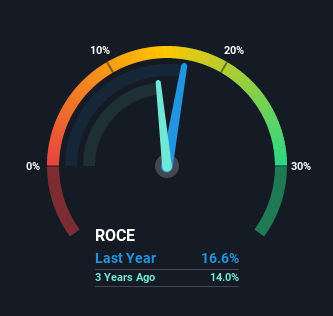
So, Johnson Matthey has an ROCE of 17%. In absolute terms, that's a satisfactory return, but compared to the Chemicals industry average of 11% it's much better.
Check out our latest analysis for Johnson Matthey
Above you can see how the current ROCE for Johnson Matthey compares to its prior returns on capital, but there's only so much you can tell from the past. If you're interested, you can view the analysts predictions in our free report on analyst forecasts for the company.
What Does the ROCE Trend For Johnson Matthey Tell Us?
While the current returns on capital are decent, they haven't changed much. The company has employed 27% more capital in the last five years, and the returns on that capital have remained stable at 17%. 17% is a pretty standard return, and it provides some comfort knowing that Johnson Matthey has consistently earned this amount. Over long periods of time, returns like these might not be too exciting, but with consistency they can pay off in terms of share price returns.
Another point to note, we noticed the company has increased current liabilities over the last five years. This is intriguing because if current liabilities hadn't increased to 48% of total assets, this reported ROCE would probably be less than17% because total capital employed would be higher.The 17% ROCE could be even lower if current liabilities weren't 48% of total assets, because the the formula would show a larger base of total capital employed. Additionally, this high level of current liabilities isn't ideal because it means the company's suppliers (or short-term creditors) are effectively funding a large portion of the business.
The Bottom Line On Johnson Matthey's ROCE
In the end, Johnson Matthey has proven its ability to adequately reinvest capital at good rates of return. However, despite the favorable fundamentals, the stock has fallen 29% over the last five years, so there might be an opportunity here for astute investors. For that reason, savvy investors might want to look further into this company in case it's a prime investment.
Johnson Matthey does have some risks though, and we've spotted 3 warning signs for Johnson Matthey that you might be interested in.
While Johnson Matthey isn't earning the highest return, check out this free list of companies that are earning high returns on equity with solid balance sheets.
Have feedback on this article? Concerned about the content? Get in touch with us directly. Alternatively, email editorial-team (at) simplywallst.com.
This article by Simply Wall St is general in nature. We provide commentary based on historical data and analyst forecasts only using an unbiased methodology and our articles are not intended to be financial advice. It does not constitute a recommendation to buy or sell any stock, and does not take account of your objectives, or your financial situation. We aim to bring you long-term focused analysis driven by fundamental data. Note that our analysis may not factor in the latest price-sensitive company announcements or qualitative material. Simply Wall St has no position in any stocks mentioned.
