
 Yahoo Finance
 Joules Group (LON:JOUL) Will Be Hoping To Turn Its Returns On Capital Around
If we want to find a potential multi-bagger, often there are underlying trends that can provide clues. Firstly, we'd want to identify a growing return on capital employed (ROCE) and then alongside that, an ever-increasing base of capital employed. Ultimately, this demonstrates that it's a business that is reinvesting profits at increasing rates of return. In light of that, when we looked at Joules Group (LON:JOUL) and its ROCE trend, we weren't exactly thrilled.
Return On Capital Employed (ROCE): What is it?
For those who don't know, ROCE is a measure of a company's yearly pre-tax profit (its return), relative to the capital employed in the business. To calculate this metric for Joules Group, this is the formula:
Return on Capital Employed = Earnings Before Interest and Tax (EBIT) ÷ (Total Assets - Current Liabilities)
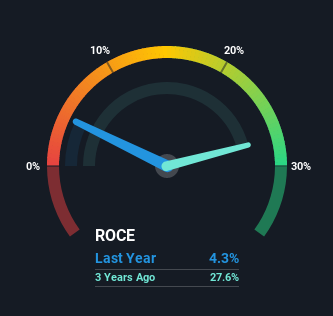
0.043 = UK£3.6m ÷ (UK£173m - UK£91m) (Based on the trailing twelve months to May 2021).
So, Joules Group has an ROCE of 4.3%. Ultimately, that's a low return and it under-performs the Luxury industry average of 15%.
Check out our latest analysis for Joules Group
In the above chart we have measured Joules Group's prior ROCE against its prior performance, but the future is arguably more important. If you're interested, you can view the analysts predictions in our free report on analyst forecasts for the company.
What Can We Tell From Joules Group's ROCE Trend?
In terms of Joules Group's historical ROCE movements, the trend isn't fantastic. Over the last five years, returns on capital have decreased to 4.3% from 33% five years ago. However it looks like Joules Group might be reinvesting for long term growth because while capital employed has increased, the company's sales haven't changed much in the last 12 months. It's worth keeping an eye on the company's earnings from here on to see if these investments do end up contributing to the bottom line.
On a separate but related note, it's important to know that Joules Group has a current liabilities to total assets ratio of 52%, which we'd consider pretty high. This effectively means that suppliers (or short-term creditors) are funding a large portion of the business, so just be aware that this can introduce some elements of risk. While it's not necessarily a bad thing, it can be beneficial if this ratio is lower.
In Conclusion...
To conclude, we've found that Joules Group is reinvesting in the business, but returns have been falling. Although the market must be expecting these trends to improve because the stock has gained 66% over the last five years. Ultimately, if the underlying trends persist, we wouldn't hold our breath on it being a multi-bagger going forward.
Joules Group does have some risks though, and we've spotted 1 warning sign for Joules Group that you might be interested in.
For those who like to invest in solid companies, check out this free list of companies with solid balance sheets and high returns on equity.
This article by Simply Wall St is general in nature. It does not constitute a recommendation to buy or sell any stock, and does not take account of your objectives, or your financial situation. We aim to bring you long-term focused analysis driven by fundamental data. Note that our analysis may not factor in the latest price-sensitive company announcements or qualitative material. Simply Wall St has no position in any stocks mentioned.
Have feedback on this article? Concerned about the content? Get in touch with us directly. Alternatively, email editorial-team (at) simplywallst.com.
