
 Yahoo Finance
 Here’s What Joules Group Plc’s (LON:JOUL) Return On Capital Can Tell Us

Today we are going to look at Joules Group Plc (LON:JOUL) to see whether it might be an attractive investment prospect. To be precise, we'll consider its Return On Capital Employed (ROCE), as that will inform our view of the quality of the business.
First of all, we'll work out how to calculate ROCE. Then we'll compare its ROCE to similar companies. Last but not least, we'll look at what impact its current liabilities have on its ROCE.
Understanding Return On Capital Employed (ROCE)
ROCE measures the 'return' (pre-tax profit) a company generates from capital employed in its business. Generally speaking a higher ROCE is better. Overall, it is a valuable metric that has its flaws. Renowned investment researcher Michael Mauboussin has suggested that a high ROCE can indicate that 'one dollar invested in the company generates value of more than one dollar'.
So, How Do We Calculate ROCE?
The formula for calculating the return on capital employed is:
Return on Capital Employed = Earnings Before Interest and Tax (EBIT) ÷ (Total Assets - Current Liabilities)
Or for Joules Group:
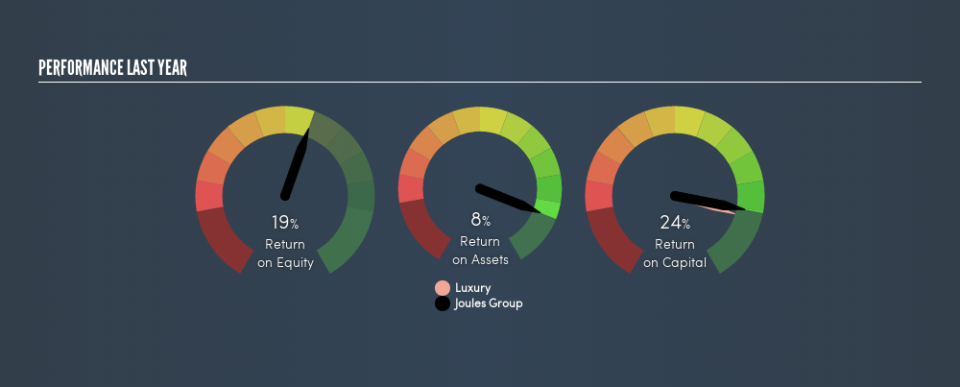
0.24 = UK£13m ÷ (UK£117m - UK£64m) (Based on the trailing twelve months to November 2018.)
So, Joules Group has an ROCE of 24%.
See our latest analysis for Joules Group
Does Joules Group Have A Good ROCE?
When making comparisons between similar businesses, investors may find ROCE useful. It appears that Joules Group's ROCE is fairly close to the Luxury industry average of 23%. Setting aside the comparison to its industry for a moment, Joules Group's ROCE in absolute terms currently looks quite high.
Remember that this metric is backwards looking - it shows what has happened in the past, and does not accurately predict the future. Companies in cyclical industries can be difficult to understand using ROCE, as returns typically look high during boom times, and low during busts. ROCE is, after all, simply a snap shot of a single year. What happens in the future is pretty important for investors, so we have prepared a free report on analyst forecasts for Joules Group.
How Joules Group's Current Liabilities Impact Its ROCE
Current liabilities include invoices, such as supplier payments, short-term debt, or a tax bill, that need to be paid within 12 months. Due to the way the ROCE equation works, having large bills due in the near term can make it look as though a company has less capital employed, and thus a higher ROCE than usual. To counter this, investors can check if a company has high current liabilities relative to total assets.
Joules Group has total assets of UK£117m and current liabilities of UK£64m. As a result, its current liabilities are equal to approximately 55% of its total assets. Joules Group boasts an attractive ROCE, even after considering the boost from high current liabilities.
Our Take On Joules Group's ROCE
So to us, the company is potentially worth investigating further. There might be better investments than Joules Group out there, but you will have to work hard to find them . These promising businesses with rapidly growing earnings might be right up your alley.
If you like to buy stocks alongside management, then you might just love this free list of companies. (Hint: insiders have been buying them).
We aim to bring you long-term focused research analysis driven by fundamental data. Note that our analysis may not factor in the latest price-sensitive company announcements or qualitative material.
If you spot an error that warrants correction, please contact the editor at editorial-team@simplywallst.com. This article by Simply Wall St is general in nature. It does not constitute a recommendation to buy or sell any stock, and does not take account of your objectives, or your financial situation. Simply Wall St has no position in the stocks mentioned. Thank you for reading.
