
 Yahoo Finance
 Is Just Group Plc’s (LON:JUST) CEO Being Overpaid?

Rodney Cook has been the CEO of Just Group Plc (LON:JUST) since 2016. First, this article will compare CEO compensation with compensation at similar sized companies. Next, we’ll consider growth that the business demonstrates. Third, we’ll reflect on the total return to shareholders over three years, as a second measure of business performance. This method should give us information to assess how appropriately the company pays the CEO.
View our latest analysis for Just Group
How Does Rodney Cook’s Compensation Compare With Similar Sized Companies?
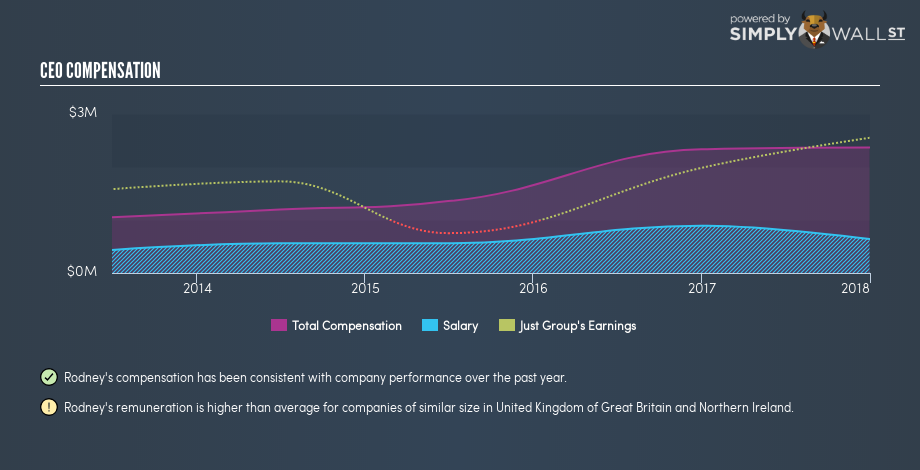
Our data indicates that Just Group Plc is worth UK£838m, and total annual CEO compensation is UK£2.4m. (This number is for the twelve months until 2017). We think total compensation is more important but we note that the CEO salary is lower, at UK£640k. We examined companies with market caps from UK£315m to UK£1.3b, and discovered that the median CEO compensation of that group was UK£1.0m.
Thus we can conclude that Rodney Cook receives more in total compensation than the median of a group of companies in the same market, and of similar size to Just Group Plc. However, this doesn’t necessarily mean the pay is too high. A closer look at the performance of the underlying business will give us a better idea about whether the pay is particularly generous.
You can see, below, how CEO compensation at Just Group has changed over time.
Is Just Group Plc Growing?
Over the last three years Just Group Plc has grown its earnings per share (EPS) by an average of 36% per year. Its revenue is up 28% over last year.
Overall this is a positive result for shareholders, showing that the company has improved in recent years. It’s great to see that revenue growth is strong, too. These metrics suggest the business is growing strongly.
Shareholders might be interested in this free visualization of analyst forecasts. .
Has Just Group Plc Been A Good Investment?
Given the total loss of 41% over three years, many shareholders in Just Group Plc are probably rather dissatisfied, to say the least. So shareholders would probably think the company shouldn’t be too generous with CEO compensation.
In Summary…
We compared the total CEO remuneration paid by Just Group Plc, and compared it to remuneration at a group of similar sized companies. As discussed above, we discovered that the company pays more than the median of that group.
Importantly, though, the company has impressed with its earnings per share growth, over three years. Having said that, shareholders may be disappointed with the weak returns over the last three years. Considering the per share profit growth, but keeping in mind the weak returns, we’d need more time to form a view on CEO compensation. Shareholders may want to check for free if Just Group insiders are buying or selling shares.
Of course, the past can be informative so you might be interested in considering this analytical visualization showing the company history of earnings and revenue.
To help readers see past the short term volatility of the financial market, we aim to bring you a long-term focused research analysis purely driven by fundamental data. Note that our analysis does not factor in the latest price-sensitive company announcements.
The author is an independent contributor and at the time of publication had no position in the stocks mentioned. For errors that warrant correction please contact the editor at editorial-team@simplywallst.com.
