
 Yahoo Finance
 K-Bro Linen Inc (TSE:KBL): Does The Earnings Decline Make It An Underperformer?

After reading K-Bro Linen Inc’s (TSX:KBL) most recent earnings announcement (31 March 2018), I found it useful to look back at how the company has performed in the past and compare this against the latest numbers. As a long term investor, I pay close attention to earnings trend, rather than the figures published at one point in time. I also compare against an industry benchmark to check whether K-Bro Linen’s performance has been impacted by industry movements. In this article I briefly touch on my key findings. See our latest analysis for K-Bro Linen
Was KBL’s recent earnings decline indicative of a tough track record?
For the purpose of this commentary, I like to use data from the most recent 12 months, which either annualizes the most recent 6-month earnings update, or in some cases, the most recent annual report is already the latest available financial data. This method enables me to analyze many different companies on a similar basis, using the latest information. For K-Bro Linen, its most recent earnings (trailing twelve month) is CA$5.12M, which, in comparison to the previous year’s level, has sunken by a substantial -50.07%. Given that these values may be fairly short-term, I have created an annualized five-year value for K-Bro Linen’s earnings, which stands at CA$10.26M This doesn’t seem to paint a better picture, as earnings seem to have steadily been declining over the longer term.
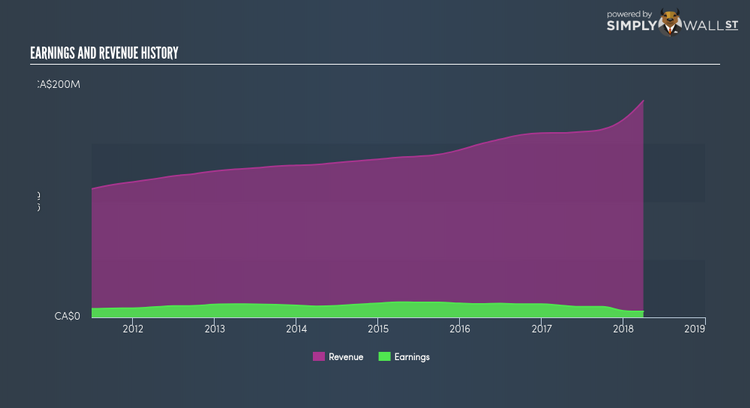
What could be happening here? Well, let’s take a look at what’s going on with margins and whether the rest of the industry is experiencing the hit as well. Revenue growth over the past few years, has been positive, however, earnings growth has not been able to catch up, meaning K-Bro Linen has been increasing its expenses by a lot more. This hurts margins and earnings, and is not a sustainable practice. Inspecting growth from a sector-level, the Canadian commercial services industry has been growing its average earnings by double-digit 24.65% over the prior year, and 30.33% over the previous five years. This shows that whatever uplift the industry is benefiting from, K-Bro Linen has not been able to realize the gains unlike its industry peers.
What does this mean?
While past data is useful, it doesn’t tell the whole story. Usually companies that face a prolonged period of diminishing earnings are undergoing some sort of reinvestment phase with the aim of keeping up with the latest industry disruption and growth. I suggest you continue to research K-Bro Linen to get a more holistic view of the stock by looking at:
Future Outlook: What are well-informed industry analysts predicting for KBL’s future growth? Take a look at our free research report of analyst consensus for KBL’s outlook.
Financial Health: Is KBL’s operations financially sustainable? Balance sheets can be hard to analyze, which is why we’ve done it for you. Check out our financial health checks here.
Other High-Performing Stocks: Are there other stocks that provide better prospects with proven track records? Explore our free list of these great stocks here.
NB: Figures in this article are calculated using data from the trailing twelve months from 31 March 2018. This may not be consistent with full year annual report figures.
To help readers see pass the short term volatility of the financial market, we aim to bring you a long-term focused research analysis purely driven by fundamental data. Note that our analysis does not factor in the latest price sensitive company announcements.
The author is an independent contributor and at the time of publication had no position in the stocks mentioned.
