
 Yahoo Finance
 Kandi Technologies Group (NASDAQ:KNDI) investors are sitting on a loss of 53% if they invested five years ago
Statistically speaking, long term investing is a profitable endeavour. But along the way some stocks are going to perform badly. For example the Kandi Technologies Group, Inc. (NASDAQ:KNDI) share price dropped 53% over five years. That's an unpleasant experience for long term holders. On the other hand the share price has bounced 6.5% over the last week.
With that in mind, it's worth seeing if the company's underlying fundamentals have been the driver of long term performance, or if there are some discrepancies.
View our latest analysis for Kandi Technologies Group
Given that Kandi Technologies Group didn't make a profit in the last twelve months, we'll focus on revenue growth to form a quick view of its business development. When a company doesn't make profits, we'd generally expect to see good revenue growth. Some companies are willing to postpone profitability to grow revenue faster, but in that case one does expect good top-line growth.
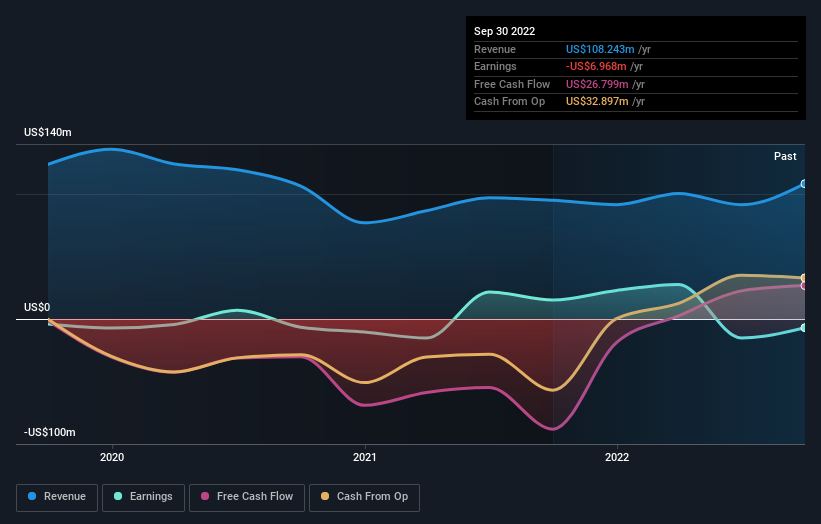
In the last five years Kandi Technologies Group saw its revenue shrink by 1.8% per year. That's not what investors generally want to see. The share price decline of 9% compound, over five years, is understandable given the company is losing money, and revenue is moving in the wrong direction. The chance of imminent investor enthusiasm for this stock seems slimmer than Louise Brooks. Not that many investors like to invest in companies that are losing money and not growing revenue.
You can see how earnings and revenue have changed over time in the image below (click on the chart to see the exact values).
Take a more thorough look at Kandi Technologies Group's financial health with this free report on its balance sheet.
A Different Perspective
We regret to report that Kandi Technologies Group shareholders are down 14% for the year. Unfortunately, that's worse than the broader market decline of 6.2%. However, it could simply be that the share price has been impacted by broader market jitters. It might be worth keeping an eye on the fundamentals, in case there's a good opportunity. However, the loss over the last year isn't as bad as the 9% per annum loss investors have suffered over the last half decade. We would want clear information suggesting the company will grow, before taking the view that the share price will stabilize. You could get a better understanding of Kandi Technologies Group's growth by checking out this more detailed historical graph of earnings, revenue and cash flow.
For those who like to find winning investments this free list of growing companies with recent insider purchasing, could be just the ticket.
Please note, the market returns quoted in this article reflect the market weighted average returns of stocks that currently trade on US exchanges.
Have feedback on this article? Concerned about the content? Get in touch with us directly. Alternatively, email editorial-team (at) simplywallst.com.
This article by Simply Wall St is general in nature. We provide commentary based on historical data and analyst forecasts only using an unbiased methodology and our articles are not intended to be financial advice. It does not constitute a recommendation to buy or sell any stock, and does not take account of your objectives, or your financial situation. We aim to bring you long-term focused analysis driven by fundamental data. Note that our analysis may not factor in the latest price-sensitive company announcements or qualitative material. Simply Wall St has no position in any stocks mentioned.
Join A Paid User Research Session
You’ll receive a US$30 Amazon Gift card for 1 hour of your time while helping us build better investing tools for the individual investors like yourself. Sign up here
