
 Yahoo Finance
 Karoon Energy (ASX:KAR) Is Experiencing Growth In Returns On Capital
If we want to find a potential multi-bagger, often there are underlying trends that can provide clues. Typically, we'll want to notice a trend of growing return on capital employed (ROCE) and alongside that, an expanding base of capital employed. If you see this, it typically means it's a company with a great business model and plenty of profitable reinvestment opportunities. So when we looked at Karoon Energy (ASX:KAR) and its trend of ROCE, we really liked what we saw.
Return On Capital Employed (ROCE): What is it?
For those that aren't sure what ROCE is, it measures the amount of pre-tax profits a company can generate from the capital employed in its business. Analysts use this formula to calculate it for Karoon Energy:
Return on Capital Employed = Earnings Before Interest and Tax (EBIT) ÷ (Total Assets - Current Liabilities)
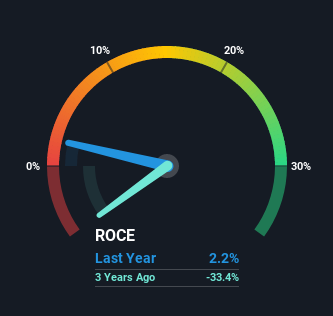
0.022 = US$19m ÷ (US$1.0b - US$130m) (Based on the trailing twelve months to June 2021).
Thus, Karoon Energy has an ROCE of 2.2%. Ultimately, that's a low return and it under-performs the Oil and Gas industry average of 2.9%.
Check out our latest analysis for Karoon Energy
In the above chart we have measured Karoon Energy's prior ROCE against its prior performance, but the future is arguably more important. If you'd like to see what analysts are forecasting going forward, you should check out our free report for Karoon Energy.
How Are Returns Trending?
We're delighted to see that Karoon Energy is reaping rewards from its investments and is now generating some pre-tax profits. The company was generating losses five years ago, but now it's earning 2.2% which is a sight for sore eyes. In addition to that, Karoon Energy is employing 31% more capital than previously which is expected of a company that's trying to break into profitability. This can indicate that there's plenty of opportunities to invest capital internally and at ever higher rates, both common traits of a multi-bagger.
For the record though, there was a noticeable increase in the company's current liabilities over the period, so we would attribute some of the ROCE growth to that. The current liabilities has increased to 13% of total assets, so the business is now more funded by the likes of its suppliers or short-term creditors. Keep an eye out for future increases because when the ratio of current liabilities to total assets gets particularly high, this can introduce some new risks for the business.
What We Can Learn From Karoon Energy's ROCE
Overall, Karoon Energy gets a big tick from us thanks in most part to the fact that it is now profitable and is reinvesting in its business. Astute investors may have an opportunity here because the stock has declined 22% in the last five years. That being the case, research into the company's current valuation metrics and future prospects seems fitting.
One final note, you should learn about the 2 warning signs we've spotted with Karoon Energy (including 1 which doesn't sit too well with us) .
For those who like to invest in solid companies, check out this free list of companies with solid balance sheets and high returns on equity.
This article by Simply Wall St is general in nature. We provide commentary based on historical data and analyst forecasts only using an unbiased methodology and our articles are not intended to be financial advice. It does not constitute a recommendation to buy or sell any stock, and does not take account of your objectives, or your financial situation. We aim to bring you long-term focused analysis driven by fundamental data. Note that our analysis may not factor in the latest price-sensitive company announcements or qualitative material. Simply Wall St has no position in any stocks mentioned.
Have feedback on this article? Concerned about the content? Get in touch with us directly. Alternatively, email editorial-team (at) simplywallst.com.
