
 Yahoo Finance
 Is KBC Group NV (EBR:KBC) An Attractive Dividend Stock?

A large part of investment returns can be generated by dividend-paying stock given their role in compounding returns over time. In the past 10 years KBC Group NV (EBR:KBC) has returned an average of 2.00% per year to investors in the form of dividend payouts. Does KBC Group tick all the boxes of a great dividend stock? Below, I’ll take you through my analysis. View out our latest analysis for KBC Group
5 checks you should use to assess a dividend stock
Whenever I am looking at a potential dividend stock investment, I always check these five metrics:
Is it the top 25% annual dividend yield payer?
Has its dividend been stable over the past (i.e. no missed payments or significant payout cuts)?
Has dividend per share risen in the past couple of years?
Is is able to pay the current rate of dividends from its earnings?
Based on future earnings growth, will it be able to continue to payout dividend at the current rate?
Does KBC Group pass our checks?
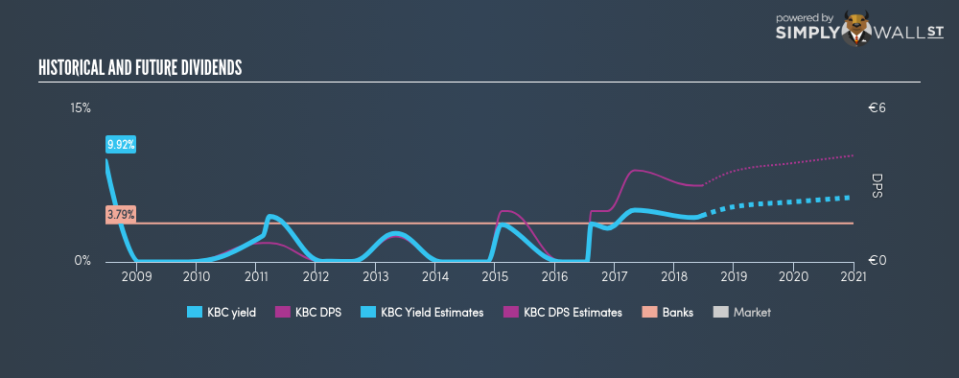
KBC Group has a trailing twelve-month payout ratio of 51.24%, meaning the dividend is sufficiently covered by earnings. Going forward, analysts expect KBC’s payout to increase to 65.89% of its earnings, which leads to a dividend yield of around 5.87%. Moreover, EPS should increase to €6.08. The higher payout forecasted, along with higher earnings, should lead to greater dividend income for investors moving forward.
Reliablity is an important factor for dividend stocks, particularly for income investors who want a strong track record of payment and a positive outlook for future payout. Not only have dividend payouts from KBC Group fallen over the past 10 years, it has also been highly volatile during this time, with drops of over 25% in some years. This means that dividend hunters should probably steer clear of the stock, at least for now until the track record improves.
Relative to peers, KBC Group generates a yield of 4.55%, which is high for Banks stocks but still below the market’s top dividend payers.
Next Steps:
Taking all the above into account, KBC Group is a complicated pick for dividend investors given that there are a couple of positive things about it as well as negative. But if you are not exclusively a dividend investor, the stock could still be an interesting investment opportunity. Given that this is purely a dividend analysis, you should always research extensively before deciding whether or not a stock is an appropriate investment for you. I always recommend analysing the company’s fundamentals and underlying business before making an investment decision. Below, I’ve compiled three fundamental aspects you should further examine:
Future Outlook: What are well-informed industry analysts predicting for KBC’s future growth? Take a look at our free research report of analyst consensus for KBC’s outlook.
Valuation: What is KBC worth today? Even if the stock is a cash cow, it’s not worth an infinite price. The intrinsic value infographic in our free research report helps visualize whether KBC is currently mispriced by the market.
Dividend Rockstars: Are there better dividend payers with stronger fundamentals out there? Check out our free list of these great stocks here.
To help readers see pass the short term volatility of the financial market, we aim to bring you a long-term focused research analysis purely driven by fundamental data. Note that our analysis does not factor in the latest price sensitive company announcements.
The author is an independent contributor and at the time of publication had no position in the stocks mentioned.
