
 Yahoo Finance
 Kendrion N.V.'s (AMS:KENDR) Has Been On A Rise But Financial Prospects Look Weak: Is The Stock Overpriced?
Most readers would already be aware that Kendrion's (AMS:KENDR) stock increased significantly by 12% over the past three months. However, in this article, we decided to focus on its weak fundamentals, as long-term financial performance of a business is what ultimately dictates market outcomes. Specifically, we decided to study Kendrion's ROE in this article.
Return on Equity or ROE is a test of how effectively a company is growing its value and managing investors’ money. In short, ROE shows the profit each dollar generates with respect to its shareholder investments.
View our latest analysis for Kendrion
How To Calculate Return On Equity?
The formula for ROE is:
Return on Equity = Net Profit (from continuing operations) ÷ Shareholders' Equity
So, based on the above formula, the ROE for Kendrion is:
5.8% = €9.9m ÷ €172m (Based on the trailing twelve months to December 2023).
The 'return' is the yearly profit. Another way to think of that is that for every €1 worth of equity, the company was able to earn €0.06 in profit.
What Is The Relationship Between ROE And Earnings Growth?
Thus far, we have learned that ROE measures how efficiently a company is generating its profits. Depending on how much of these profits the company reinvests or "retains", and how effectively it does so, we are then able to assess a company’s earnings growth potential. Assuming all else is equal, companies that have both a higher return on equity and higher profit retention are usually the ones that have a higher growth rate when compared to companies that don't have the same features.
Kendrion's Earnings Growth And 5.8% ROE
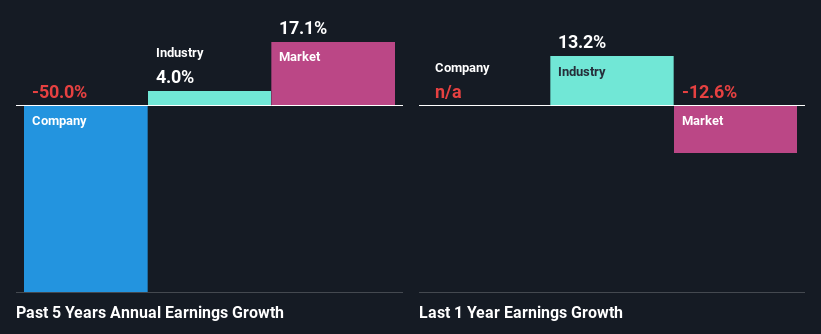
At first glance, Kendrion's ROE doesn't look very promising. Next, when compared to the average industry ROE of 8.7%, the company's ROE leaves us feeling even less enthusiastic. Given the circumstances, the significant decline in net income by 50% seen by Kendrion over the last five years is not surprising. We reckon that there could also be other factors at play here. For example, it is possible that the business has allocated capital poorly or that the company has a very high payout ratio.
That being said, we compared Kendrion's performance with the industry and were concerned when we found that while the company has shrunk its earnings, the industry has grown its earnings at a rate of 4.0% in the same 5-year period.
Earnings growth is a huge factor in stock valuation. What investors need to determine next is if the expected earnings growth, or the lack of it, is already built into the share price. This then helps them determine if the stock is placed for a bright or bleak future. Is Kendrion fairly valued compared to other companies? These 3 valuation measures might help you decide.
Is Kendrion Making Efficient Use Of Its Profits?
Kendrion's declining earnings is not surprising given how the company is spending most of its profits in paying dividends, judging by its three-year median payout ratio of 73% (or a retention ratio of 27%). With only very little left to reinvest into the business, growth in earnings is far from likely. To know the 2 risks we have identified for Kendrion visit our risks dashboard for free.
Additionally, Kendrion has paid dividends over a period of at least ten years, which means that the company's management is determined to pay dividends even if it means little to no earnings growth. Upon studying the latest analysts' consensus data, we found that the company's future payout ratio is expected to drop to 41% over the next three years. The fact that the company's ROE is expected to rise to 11% over the same period is explained by the drop in the payout ratio.
Conclusion
Overall, we would be extremely cautious before making any decision on Kendrion. Because the company is not reinvesting much into the business, and given the low ROE, it's not surprising to see the lack or absence of growth in its earnings. With that said, we studied the latest analyst forecasts and found that while the company has shrunk its earnings in the past, analysts expect its earnings to grow in the future. To know more about the company's future earnings growth forecasts take a look at this free report on analyst forecasts for the company to find out more.
Have feedback on this article? Concerned about the content? Get in touch with us directly. Alternatively, email editorial-team (at) simplywallst.com.
This article by Simply Wall St is general in nature. We provide commentary based on historical data and analyst forecasts only using an unbiased methodology and our articles are not intended to be financial advice. It does not constitute a recommendation to buy or sell any stock, and does not take account of your objectives, or your financial situation. We aim to bring you long-term focused analysis driven by fundamental data. Note that our analysis may not factor in the latest price-sensitive company announcements or qualitative material. Simply Wall St has no position in any stocks mentioned.
