
 Yahoo Finance
 Kensington v Ebbw Vale: floor space price study highlights property divide
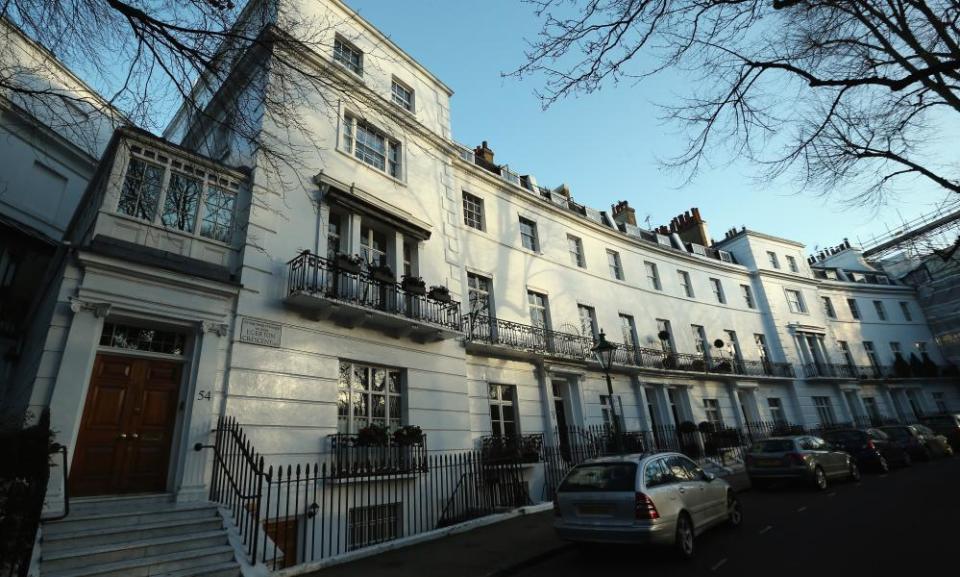
It now costs nearly £19,500 to buy enough residential floorspace for a decent-sized coffee table in London’s priciest borough – but only £777 to accommodate the same small piece of furniture in a living room in south Wales, according to official statistics that highlight a widening north-south divide.
According to the Office for National Statistics (ONS), the average cost of one square metre of residential floor space in England and Wales last year was £2,395.
However, this disguised large variations in price. The figure for London was £6,639, with the royal borough of Kensington and Chelsea topping the table at £19,439. Just 15 miles across the capital, in the borough of Barking and Dagenham, homes cost £3,994 per sq metre.
Explore property prices per sq m across England and Wales
The cheapest area was the Welsh county borough of Blaenau Gwent, which includes the town of Ebbw Vale, where a buyer would pay £777 per sq metre, followed by the Lancashire town of Burnley (£838) and Merthyr Tydfil, also in south Wales (£917).
Elmbridge in Surrey – which includes upmarket commuter belt towns such as Weybridge and Esher – was the costliest area outside London, while York was the most expensive area in the north of England.
The ONS said the data showed “a clear north-south divide, both in levels but also in growth terms”. Between 2004 and 2016, price per metre in London nearly doubled (98%), with the east of England and the south-east both increasing by around 55% over the period. At the other end of the scale, price per metre in the north-east was up by less than 19% over the same period and by 35% in the north-west.
“Unsurprisingly, 19 of the top 20 most expensive local authority areas are in London, with Kensington and Chelsea, the City of London, Westminster and Camden topping the list,” said the ONS.
In the new report, the country’s top statisticians also said they had found that new flats in England and Wales had got 18% bigger in the last three years, while new houses had stayed about the same size.
The data showed that the average house sold in England and Wales last year had a floor area of 104 sq metres, which the ONS said was about 40% of the size of a tennis court. Flats averaged 49 sq metres, which they calculate is just over four times bigger than a typical car parking space – though this excludes bathrooms, corridors, hallways and landings.
Taking flats and houses together, the typical property sold in 2016 was 90 sq metres, which the ONS said was “a little smaller” than the EU average.
In Germany, France and Italy, the average home is 94 sq metres, and in Scotland it is 96 sq metres, said the statisticians.
Residents of Luxembourg and Cyprus have much more living space: typical homes there are 131 and 141 sq metres respectively, but Romanians have to cram into homes that average only 45 sq metres.
Extension value calculator
American homebuyers, however, can generally expect something far grander – the average new home in the US is 245 sq metres.
In the UK there has been concern about a new wave of “micro-homes” – tiny flats, often in converted office buildings, that are sometimes only the size of a typical bedroom.
However, the ONS said: “New properties are a lot bigger than existing ones: in 2016, the average new house sold was 13% bigger than the average existing house, while the average new flat was 17% bigger than the average existing flat.”
The 10 most expensive areas in England and Wales, per sq metre floor space
Kensington and Chelsea £19,439
City of London £17,371
City of Westminster £16,246
Camden £12,671
Hammersmith and Fulham £10,718
Islington £9,730
Wandsworth £9,661
Southwark £8,782
Hackney £8,564
Tower Hamlets £8,545
The 10 least expensive areas in England and Wales per sq metre floor space
Blaenau Gwent £777
Burnley £838
Merthyr Tydfil £917
Hyndburn £976
Neath Port Talbot £984
Pendle £985
Hartlepool £987
Rhondda Cynon Taf £991
County Durham £992
Blackburn with Darwen £1,053
