
 Yahoo Finance
 Kimberly-Clark Corporation (NYSE:KMB): Does The -17.22% Earnings Drop Reflect A Longer Term Trend?

Understanding how Kimberly-Clark Corporation (NYSE:KMB) is performing as a company requires looking at more than just a years’ earnings. Today I will run you through a basic sense check to gain perspective on how Kimberly-Clark is doing by comparing its latest earnings with its long-term trend as well as the performance of its household products industry peers. View our latest analysis for Kimberly-Clark
Was KMB’s recent earnings decline worse than the long-term trend and the industry?
For the most up-to-date info, I use the ‘latest twelve-month’ data, which annualizes the latest 6-month earnings release, or some times, the latest annual report is already the most recent financial data. This technique enables me to analyze many different companies on a similar basis, using the most relevant data points. For Kimberly-Clark, its most recent bottom-line (trailing twelve month) is US$1.81B, which, against the previous year’s level, has plunged by -17.22%. Since these figures are somewhat short-term thinking, I’ve created an annualized five-year figure for Kimberly-Clark’s earnings, which stands at US$1.72B This shows that despite the fact that earnings declined against the previous year, over the past couple of years, Kimberly-Clark’s profits have been rising on average.
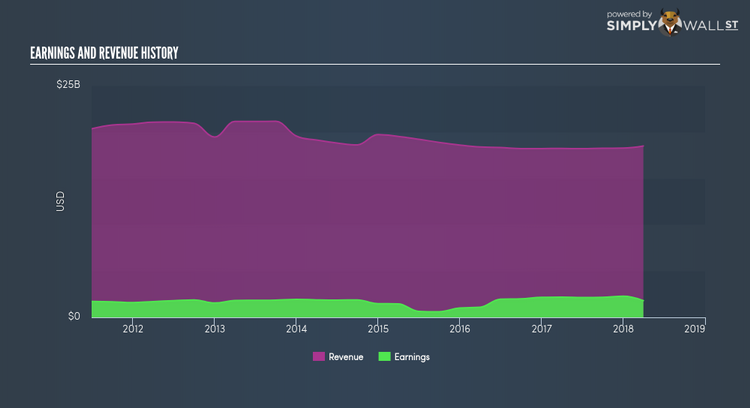
What’s enabled this growth? Let’s see whether it is merely owing to industry tailwinds, or if Kimberly-Clark has seen some company-specific growth. Over the last couple of years, Kimberly-Clark increased bottom-line, while its top-line fell, by efficiently controlling its costs. This resulted in to a margin expansion and profitability over time. Looking at growth from a sector-level, the US household products industry has been growing its average earnings by double-digit 17.28% in the past year, and a less exciting 9.58% over the past five years. This means whatever uplift the industry is profiting from, Kimberly-Clark has not been able to reap as much as its average peer.
What does this mean?
While past data is useful, it doesn’t tell the whole story. Companies that are profitable, but have unpredictable earnings, can have many factors affecting its business. I suggest you continue to research Kimberly-Clark to get a better picture of the stock by looking at:
Future Outlook: What are well-informed industry analysts predicting for KMB’s future growth? Take a look at our free research report of analyst consensus for KMB’s outlook.
Financial Health: Is KMB’s operations financially sustainable? Balance sheets can be hard to analyze, which is why we’ve done it for you. Check out our financial health checks here.
Other High-Performing Stocks: Are there other stocks that provide better prospects with proven track records? Explore our free list of these great stocks here.
NB: Figures in this article are calculated using data from the trailing twelve months from 31 March 2018. This may not be consistent with full year annual report figures.
To help readers see pass the short term volatility of the financial market, we aim to bring you a long-term focused research analysis purely driven by fundamental data. Note that our analysis does not factor in the latest price sensitive company announcements.
The author is an independent contributor and at the time of publication had no position in the stocks mentioned.
