
 Yahoo Finance
 Kimco Realty (NYSE:KIM) stock performs better than its underlying earnings growth over last three years
It hasn't been the best quarter for Kimco Realty Corporation (NYSE:KIM) shareholders, since the share price has fallen 20% in that time. But at least the stock is up over the last three years. However, it's unlikely many shareholders are elated with the share price gain of 13% over that time, given the rising market.
Since it's been a strong week for Kimco Realty shareholders, let's have a look at trend of the longer term fundamentals.
Check out our latest analysis for Kimco Realty
While markets are a powerful pricing mechanism, share prices reflect investor sentiment, not just underlying business performance. One way to examine how market sentiment has changed over time is to look at the interaction between a company's share price and its earnings per share (EPS).
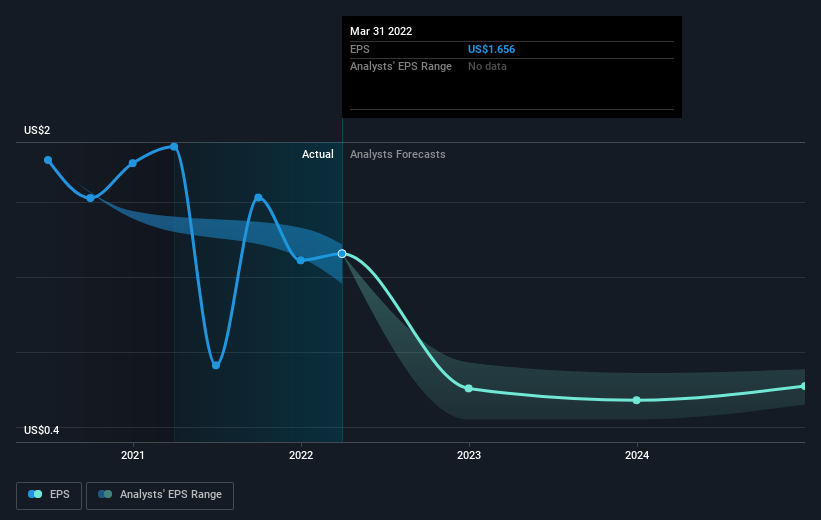
During three years of share price growth, Kimco Realty achieved compound earnings per share growth of 16% per year. The average annual share price increase of 4% is actually lower than the EPS growth. So one could reasonably conclude that the market has cooled on the stock.
You can see below how EPS has changed over time (discover the exact values by clicking on the image).
It might be well worthwhile taking a look at our free report on Kimco Realty's earnings, revenue and cash flow.
What About Dividends?
When looking at investment returns, it is important to consider the difference between total shareholder return (TSR) and share price return. The TSR is a return calculation that accounts for the value of cash dividends (assuming that any dividend received was reinvested) and the calculated value of any discounted capital raisings and spin-offs. So for companies that pay a generous dividend, the TSR is often a lot higher than the share price return. As it happens, Kimco Realty's TSR for the last 3 years was 28%, which exceeds the share price return mentioned earlier. And there's no prize for guessing that the dividend payments largely explain the divergence!
A Different Perspective
It's nice to see that Kimco Realty shareholders have received a total shareholder return of 0.6% over the last year. And that does include the dividend. However, the TSR over five years, coming in at 7% per year, is even more impressive. The pessimistic view would be that be that the stock has its best days behind it, but on the other hand the price might simply be moderating while the business itself continues to execute. While it is well worth considering the different impacts that market conditions can have on the share price, there are other factors that are even more important. For example, we've discovered 8 warning signs for Kimco Realty (2 are a bit unpleasant!) that you should be aware of before investing here.
If you are like me, then you will not want to miss this free list of growing companies that insiders are buying.
Please note, the market returns quoted in this article reflect the market weighted average returns of stocks that currently trade on US exchanges.
Have feedback on this article? Concerned about the content? Get in touch with us directly. Alternatively, email editorial-team (at) simplywallst.com.
This article by Simply Wall St is general in nature. We provide commentary based on historical data and analyst forecasts only using an unbiased methodology and our articles are not intended to be financial advice. It does not constitute a recommendation to buy or sell any stock, and does not take account of your objectives, or your financial situation. We aim to bring you long-term focused analysis driven by fundamental data. Note that our analysis may not factor in the latest price-sensitive company announcements or qualitative material. Simply Wall St has no position in any stocks mentioned.
