
 Yahoo Finance
 What Kind Of Investor Owns Most Of ING Groep N.V. (AMS:INGA)?

A look at the shareholders of ING Groep N.V. (AMS:INGA) can tell us which group is most powerful. Large companies usually have institutions as shareholders, and we usually see insiders owning shares in smaller companies. Companies that used to be publicly owned tend to have lower insider ownership.
With a market capitalization of €35b, ING Groep is rather large. We'd expect to see institutional investors on the register. Companies of this size are usually well known to retail investors, too. Our analysis of the ownership of the company, below, shows that institutions own shares in the company. We can zoom in on the different ownership groups, to learn more about INGA.
View our latest analysis for ING Groep
What Does The Institutional Ownership Tell Us About ING Groep?
Many institutions measure their performance against an index that approximates the local market. So they usually pay more attention to companies that are included in major indices.
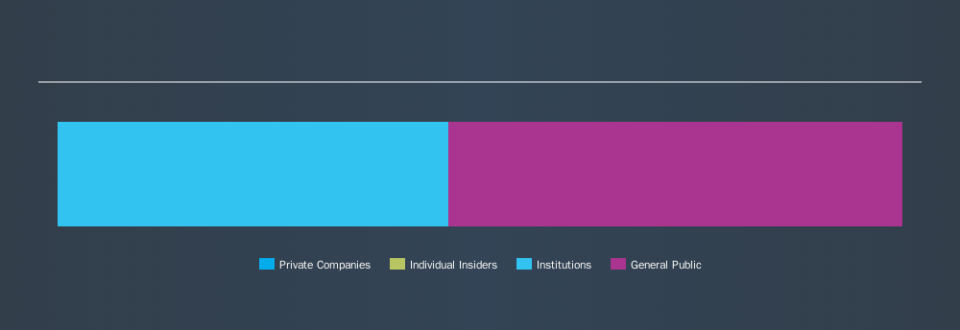
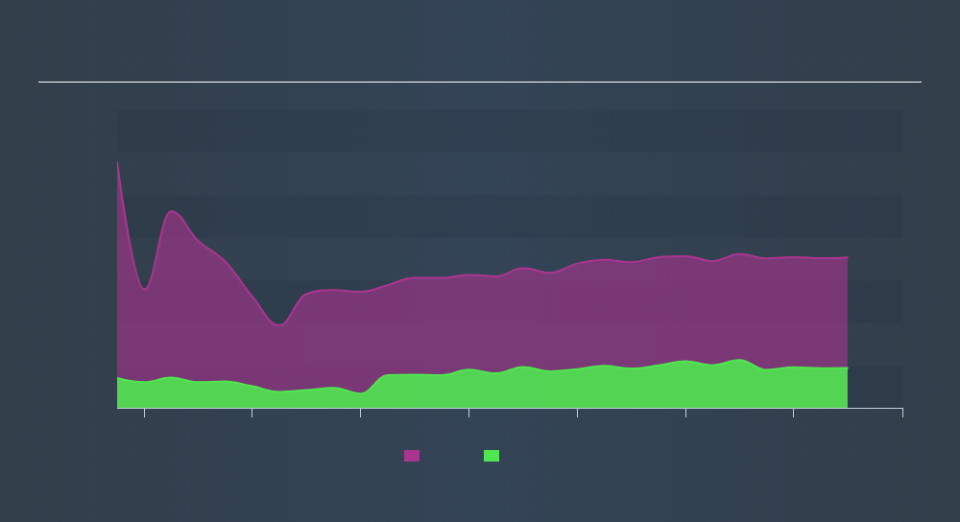
We can see that ING Groep does have institutional investors; and they hold 46% of the stock. This can indicate that the company has a certain degree of credibility in the investment community. However, it is best to be wary of relying on the supposed validation that comes with institutional investors. They too, get it wrong sometimes. It is not uncommon to see a big share price drop if two large institutional investors try to sell out of a stock at the same time. So it is worth checking the past earnings trajectory of ING Groep, (below). Of course, keep in mind that there are other factors to consider, too.
ING Groep is not owned by hedge funds. There are a reasonable number of analysts covering the stock, so it might be useful to find out their aggregate view on the future.
Insider Ownership Of ING Groep
The definition of an insider can differ slightly between different countries, but members of the board of directors always count. The company management answer to the board; and the latter should represent the interests of shareholders. Notably, sometimes top-level managers are on the board, themselves.
Most consider insider ownership a positive because it can indicate the board is well aligned with other shareholders. However, on some occasions too much power is concentrated within this group.
Our most recent data indicates that insiders own less than 1% of ING Groep N.V.. As it is a large company, we'd only expect insiders to own a small percentage of it. But it's worth noting that they own €4.0m worth of shares. Arguably recent buying and selling is just as important to consider. You can click here to see if insiders have been buying or selling.
General Public Ownership
The general public, mostly retail investors, hold a substantial 54% stake in INGA, suggesting it is a fairly popular stock. This level of ownership gives retail investors the power to sway key policy decisions such as board composition, executive compensation, and the dividend payout ratio.
Next Steps:
While it is well worth considering the different groups that own a company, there are other factors that are even more important.
I always like to check for a history of revenue growth. You can too, by accessing this free chart of historic revenue and earnings in this detailed graph.
If you would prefer discover what analysts are predicting in terms of future growth, do not miss this free report on analyst forecasts.
NB: Figures in this article are calculated using data from the last twelve months, which refer to the 12-month period ending on the last date of the month the financial statement is dated. This may not be consistent with full year annual report figures.
We aim to bring you long-term focused research analysis driven by fundamental data. Note that our analysis may not factor in the latest price-sensitive company announcements or qualitative material.
If you spot an error that warrants correction, please contact the editor at editorial-team@simplywallst.com. This article by Simply Wall St is general in nature. It does not constitute a recommendation to buy or sell any stock, and does not take account of your objectives, or your financial situation. Simply Wall St has no position in the stocks mentioned. Thank you for reading.
