
 Yahoo Finance
 What Kind Of Investor Owns Most Of Marston's PLC (LON:MARS)?

The big shareholder groups in Marston's PLC (LON:MARS) have power over the company. Insiders often own a large chunk of younger, smaller, companies while huge companies tend to have institutions as shareholders. Companies that used to be publicly owned tend to have lower insider ownership.
With a market capitalization of UK£769m, Marston's is a decent size, so it is probably on the radar of institutional investors. In the chart below below, we can see that institutions own shares in the company. We can zoom in on the different ownership groups, to learn more about MARS.
View our latest analysis for Marston's
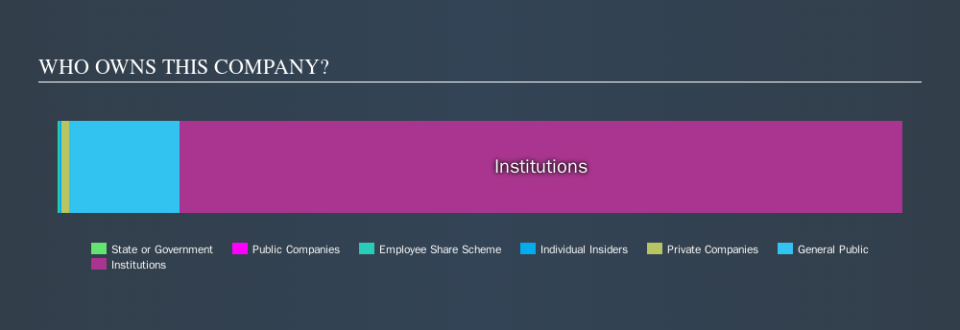
What Does The Institutional Ownership Tell Us About Marston's?
Institutions typically measure themselves against a benchmark when reporting to their own investors, so they often become more enthusiastic about a stock once it's included in a major index. We would expect most companies to have some institutions on the register, especially if they are growing.
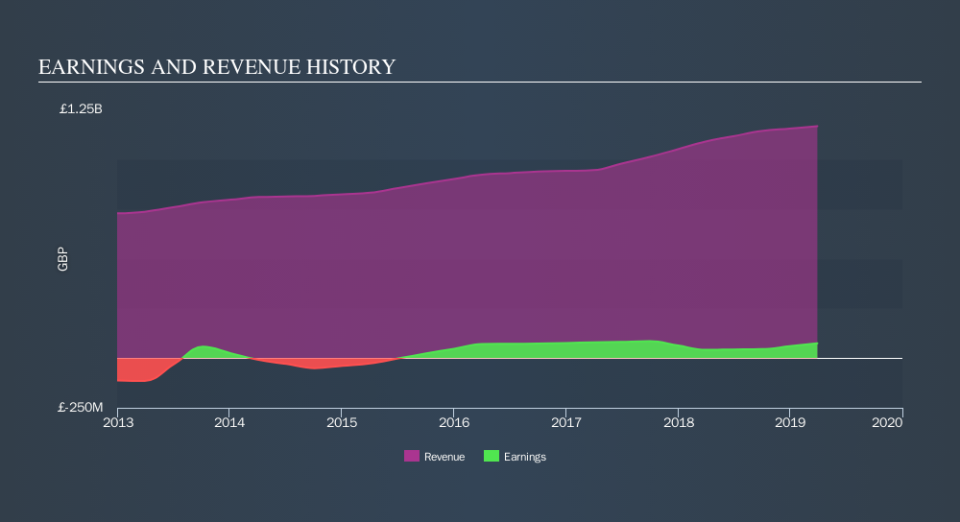
We can see that Marston's does have institutional investors; and they hold 86% of the stock. This implies the analysts working for those institutions have looked at the stock and they like it. But just like anyone else, they could be wrong. If multiple institutions change their view on a stock at the same time, you could see the share price drop fast. It's therefore worth looking at Marston's's earnings history, below. Of course, the future is what really matters.
Investors should note that institutions actually own more than half the company, so they can collectively wield significant power. Hedge funds don't have many shares in Marston's. There are a reasonable number of analysts covering the stock, so it might be useful to find out their aggregate view on the future.
Insider Ownership Of Marston's
While the precise definition of an insider can be subjective, almost everyone considers board members to be insiders. Management ultimately answers to the board. However, it is not uncommon for managers to be executive board members, especially if they are a founder or the CEO.
I generally consider insider ownership to be a good thing. However, on some occasions it makes it more difficult for other shareholders to hold the board accountable for decisions.
Our information suggests that Marston's PLC insiders own under 1% of the company. It seems the board members have no more than UK£2.2m worth of shares in the UK£769m company. Many investors in smaller companies prefer to see the board more heavily invested. You can click here to see if those insiders have been buying or selling.
General Public Ownership
The general public holds a 13% stake in MARS. While this size of ownership may not be enough to sway a policy decision in their favour, they can still make a collective impact on company policies.
Next Steps:
I find it very interesting to look at who exactly owns a company. But to truly gain insight, we need to consider other information, too.
I like to dive deeper into how a company has performed in the past. You can access this interactive graph of past earnings, revenue and cash flow, for free.
If you would prefer discover what analysts are predicting in terms of future growth, do not miss this free report on analyst forecasts.
NB: Figures in this article are calculated using data from the last twelve months, which refer to the 12-month period ending on the last date of the month the financial statement is dated. This may not be consistent with full year annual report figures.
We aim to bring you long-term focused research analysis driven by fundamental data. Note that our analysis may not factor in the latest price-sensitive company announcements or qualitative material.
If you spot an error that warrants correction, please contact the editor at editorial-team@simplywallst.com. This article by Simply Wall St is general in nature. It does not constitute a recommendation to buy or sell any stock, and does not take account of your objectives, or your financial situation. Simply Wall St has no position in the stocks mentioned. Thank you for reading.
