
 Yahoo Finance
 What Kind Of Share Price Volatility Should You Expect For The Gorman-Rupp Company (NYSE:GRC)?

Anyone researching The Gorman-Rupp Company (NYSE:GRC) might want to consider the historical volatility of the share price. Volatility is considered to be a measure of risk in modern finance theory. Investors may think of volatility as falling into two main categories. The first type is company specific volatility. Investors use diversification across uncorrelated stocks to reduce this kind of price volatility across the portfolio. The second sort is caused by the natural volatility of markets, overall. For example, certain macroeconomic events will impact (virtually) all stocks on the market.
Some stocks are more sensitive to general market forces than others. Beta is a widely used metric to measure a stock's exposure to market risk (volatility). Before we go on, it's worth noting that Warren Buffett pointed out in his 2014 letter to shareholders that 'volatility is far from synonymous with risk.' Having said that, beta can still be rather useful. The first thing to understand about beta is that the beta of the overall market is one. Any stock with a beta of greater than one is considered more volatile than the market, while those with a beta below one are either less volatile or poorly correlated with the market.
View our latest analysis for Gorman-Rupp
What does GRC's beta value mean to investors?
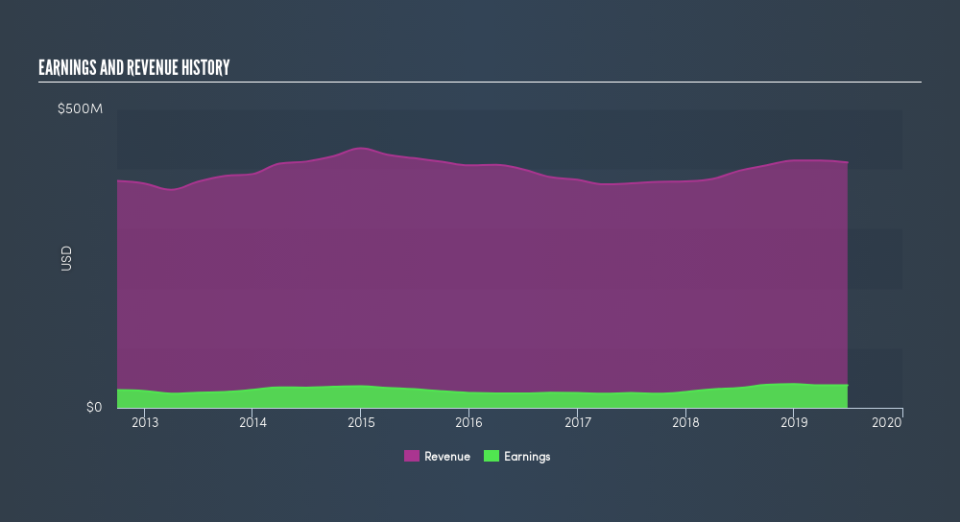
Gorman-Rupp has a five-year beta of 0.93. This is reasonably close to the market beta of 1, so the stock has in the past displayed similar levels of volatility to the overall market. If the future looks like the past, we could therefore consider it likely that the stock price will experience share price volatility that is roughly similar to the overall market. Share price volatility is well worth considering, but most long term investors consider the history of revenue and earnings growth to be more important. Take a look at how Gorman-Rupp fares in that regard, below.
Could GRC's size cause it to be more volatile?
Gorman-Rupp is a small company, but not tiny and little known. It has a market capitalisation of US$787m, which means it would be on the radar of intstitutional investors. Small companies often have a high beta value because the stock price can move on relatively low capital flows. So it's interesting to note that this stock historically has a beta value quite close to one.
What this means for you:
Since Gorman-Rupp has a beta close to one, it will probably show a positive return when the market is moving up, based on history. If you're trying to generate better returns than the market, it would be worth thinking about other metrics such as cashflows, dividends and revenue growth might be a more useful guide to the future. In order to fully understand whether GRC is a good investment for you, we also need to consider important company-specific fundamentals such as Gorman-Rupp’s financial health and performance track record. I highly recommend you dive deeper by considering the following:
Future Outlook: What are well-informed industry analysts predicting for GRC’s future growth? Take a look at our free research report of analyst consensus for GRC’s outlook.
Past Track Record: Has GRC been consistently performing well irrespective of the ups and downs in the market? Go into more detail in the past performance analysis and take a look at the free visual representations of GRC's historicals for more clarity.
Other Interesting Stocks: It's worth checking to see how GRC measures up against other companies on valuation. You could start with this free list of prospective options.
We aim to bring you long-term focused research analysis driven by fundamental data. Note that our analysis may not factor in the latest price-sensitive company announcements or qualitative material.
If you spot an error that warrants correction, please contact the editor at editorial-team@simplywallst.com. This article by Simply Wall St is general in nature. It does not constitute a recommendation to buy or sell any stock, and does not take account of your objectives, or your financial situation. Simply Wall St has no position in the stocks mentioned. Thank you for reading.
