
 Yahoo Finance
 What Kind Of Shareholders Own Akzo Nobel N.V. (AMS:AKZA)?

Every investor in Akzo Nobel N.V. (AMS:AKZA) should be aware of the most powerful shareholder groups. Insiders often own a large chunk of younger, smaller, companies while huge companies tend to have institutions as shareholders. We also tend to see lower insider ownership in companies that were previously publicly owned.
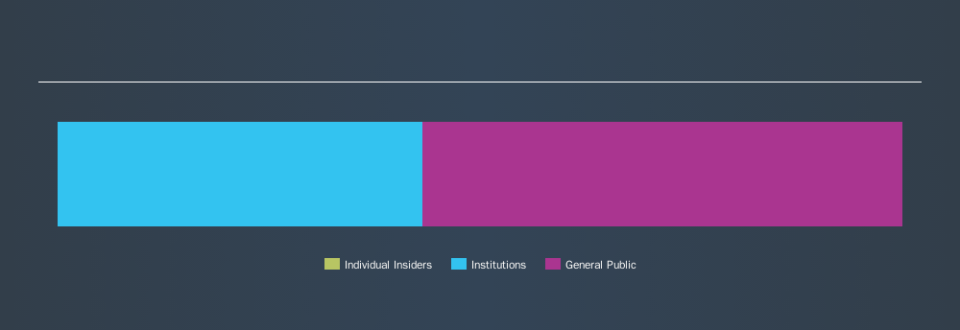
Akzo Nobel is a pretty big company. It has a market capitalization of €17b. Normally institutions would own a significant portion of a company this size. In the chart below below, we can see that institutions are noticeable on the share registry. Let's delve deeper into each type of owner, to discover more about AKZA.
See our latest analysis for Akzo Nobel
What Does The Institutional Ownership Tell Us About Akzo Nobel?
Many institutions measure their performance against an index that approximates the local market. So they usually pay more attention to companies that are included in major indices.
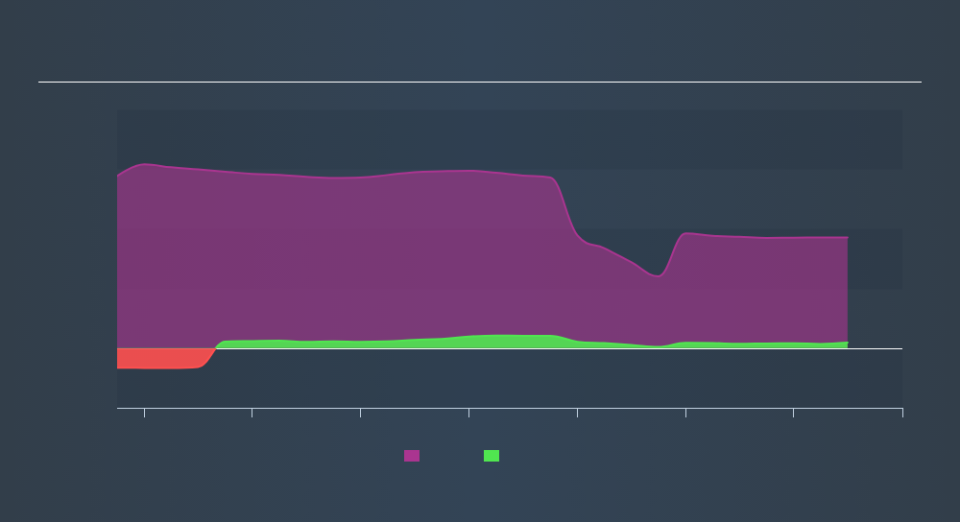
We can see that Akzo Nobel does have institutional investors; and they hold 43% of the stock. This suggests some credibility amongst professional investors. But we can't rely on that fact alone, since institutions make bad investments sometimes, just like everyone does. If multiple institutions change their view on a stock at the same time, you could see the share price drop fast. It's therefore worth looking at Akzo Nobel's earnings history, below. Of course, the future is what really matters.
Hedge funds don't have many shares in Akzo Nobel. There are a reasonable number of analysts covering the stock, so it might be useful to find out their aggregate view on the future.
Insider Ownership Of Akzo Nobel
While the precise definition of an insider can be subjective, almost everyone considers board members to be insiders. Management ultimately answers to the board. However, it is not uncommon for managers to be executive board members, especially if they are a founder or the CEO.
Most consider insider ownership a positive because it can indicate the board is well aligned with other shareholders. However, on some occasions too much power is concentrated within this group.
Our information suggests that Akzo Nobel N.V. insiders own under 1% of the company. Being so large, we would not expect insiders to own a large proportion of the stock. Collectively, they own €2.8m of stock. Arguably recent buying and selling is just as important to consider. You can click here to see if insiders have been buying or selling.
General Public Ownership
The general public -- mostly retail investors -- own 57% of Akzo Nobel . This size of ownership gives retail investors collective power. They can and probably do influence decisions on executive compensation, dividend policies and proposed business acquisitions.
Next Steps:
While it is well worth considering the different groups that own a company, there are other factors that are even more important.
I always like to check for a history of revenue growth. You can too, by accessing this free chart of historic revenue and earnings in this detailed graph.
Ultimately the future is most important. You can access this free report on analyst forecasts for the company.
NB: Figures in this article are calculated using data from the last twelve months, which refer to the 12-month period ending on the last date of the month the financial statement is dated. This may not be consistent with full year annual report figures.
We aim to bring you long-term focused research analysis driven by fundamental data. Note that our analysis may not factor in the latest price-sensitive company announcements or qualitative material.
If you spot an error that warrants correction, please contact the editor at editorial-team@simplywallst.com. This article by Simply Wall St is general in nature. It does not constitute a recommendation to buy or sell any stock, and does not take account of your objectives, or your financial situation. Simply Wall St has no position in the stocks mentioned. Thank you for reading.
