
 Yahoo Finance
 What Kind Of Shareholders Own B2Gold Corp. (TSE:BTO)?

Every investor in B2Gold Corp. (TSE:BTO) should be aware of the most powerful shareholder groups. Institutions often own shares in more established companies, while it's not unusual to see insiders own a fair bit of smaller companies. Companies that have been privatized tend to have low insider ownership.
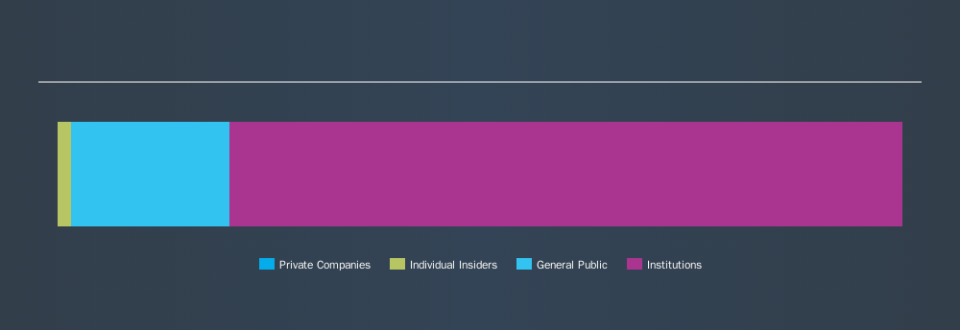
With a market capitalization of CA$4.6b, B2Gold is rather large. We'd expect to see institutional investors on the register. Companies of this size are usually well known to retail investors, too. In the chart below below, we can see that institutional investors have bought into the company. We can zoom in on the different ownership groups, to learn more about BTO.
Check out our latest analysis for B2Gold
What Does The Institutional Ownership Tell Us About B2Gold?
Institutional investors commonly compare their own returns to the returns of a commonly followed index. So they generally do consider buying larger companies that are included in the relevant benchmark index.
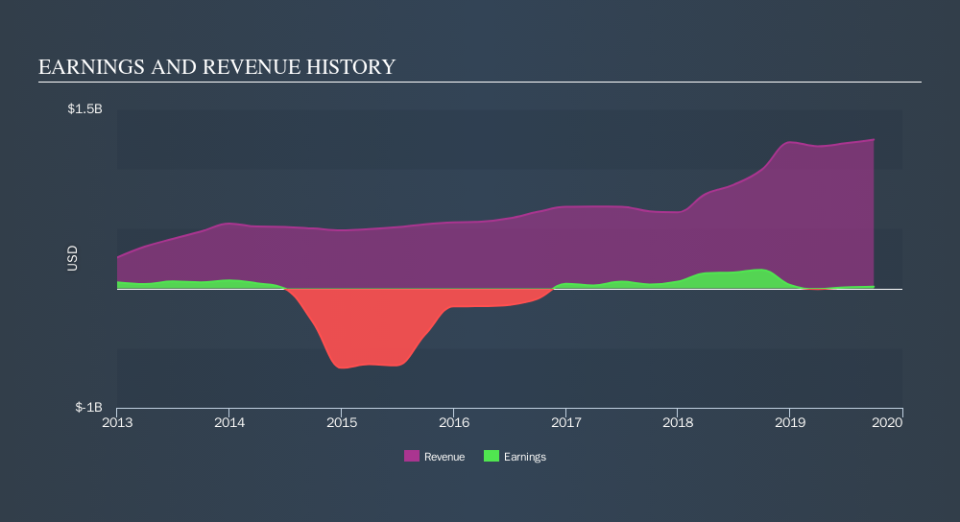
B2Gold already has institutions on the share registry. Indeed, they own 80% of the company. This suggests some credibility amongst professional investors. But we can't rely on that fact alone, since institutions make bad investments sometimes, just like everyone does. If multiple institutions change their view on a stock at the same time, you could see the share price drop fast. It's therefore worth looking at B2Gold's earnings history, below. Of course, the future is what really matters.
Since institutional investors own more than half the issued stock, the board will likely have to pay attention to their preferences. We note that hedge funds don't have a meaningful investment in B2Gold. Quite a few analysts cover the stock, so you could look into forecast growth quite easily.
Insider Ownership Of B2Gold
While the precise definition of an insider can be subjective, almost everyone considers board members to be insiders. The company management answer to the board; and the latter should represent the interests of shareholders. Notably, sometimes top-level managers are on the board, themselves.
I generally consider insider ownership to be a good thing. However, on some occasions it makes it more difficult for other shareholders to hold the board accountable for decisions.
We can see that insiders own shares in B2Gold Corp.. The insiders have a meaningful stake worth CA$82m. Most would see this as a real positive. It is good to see this level of investment by insiders. You can check here to see if those insiders have been buying recently.
General Public Ownership
The general public, with a 19% stake in the company, will not easily be ignored. This size of ownership, while considerable, may not be enough to change company policy if the decision is not in sync with other large shareholders.
Next Steps:
While it is well worth considering the different groups that own a company, there are other factors that are even more important.
Many find it useful to take an in depth look at how a company has performed in the past. You can access this detailed graph of past earnings, revenue and cash flow.
If you are like me, you may want to think about whether this company will grow or shrink. Luckily, you can check this free report showing analyst forecasts for its future.
NB: Figures in this article are calculated using data from the last twelve months, which refer to the 12-month period ending on the last date of the month the financial statement is dated. This may not be consistent with full year annual report figures.
We aim to bring you long-term focused research analysis driven by fundamental data. Note that our analysis may not factor in the latest price-sensitive company announcements or qualitative material.
If you spot an error that warrants correction, please contact the editor at editorial-team@simplywallst.com. This article by Simply Wall St is general in nature. It does not constitute a recommendation to buy or sell any stock, and does not take account of your objectives, or your financial situation. Simply Wall St has no position in the stocks mentioned. Thank you for reading.
