
 Yahoo Finance
 What Is Kinder Morgan's (NYSE:KMI) P/E Ratio After Its Share Price Tanked?

Unfortunately for some shareholders, the Kinder Morgan (NYSE:KMI) share price has dived 36% in the last thirty days. Indeed the recent decline has arguably caused some bitterness for shareholders who have held through the 30% drop over twelve months.
All else being equal, a share price drop should make a stock more attractive to potential investors. While the market sentiment towards a stock is very changeable, in the long run, the share price will tend to move in the same direction as earnings per share. The implication here is that long term investors have an opportunity when expectations of a company are too low. Perhaps the simplest way to get a read on investors' expectations of a business is to look at its Price to Earnings Ratio (PE Ratio). A high P/E ratio means that investors have a high expectation about future growth, while a low P/E ratio means they have low expectations about future growth.
Check out our latest analysis for Kinder Morgan
How Does Kinder Morgan's P/E Ratio Compare To Its Peers?
We can tell from its P/E ratio of 14.41 that there is some investor optimism about Kinder Morgan. You can see in the image below that the average P/E (6.7) for companies in the oil and gas industry is lower than Kinder Morgan's P/E.
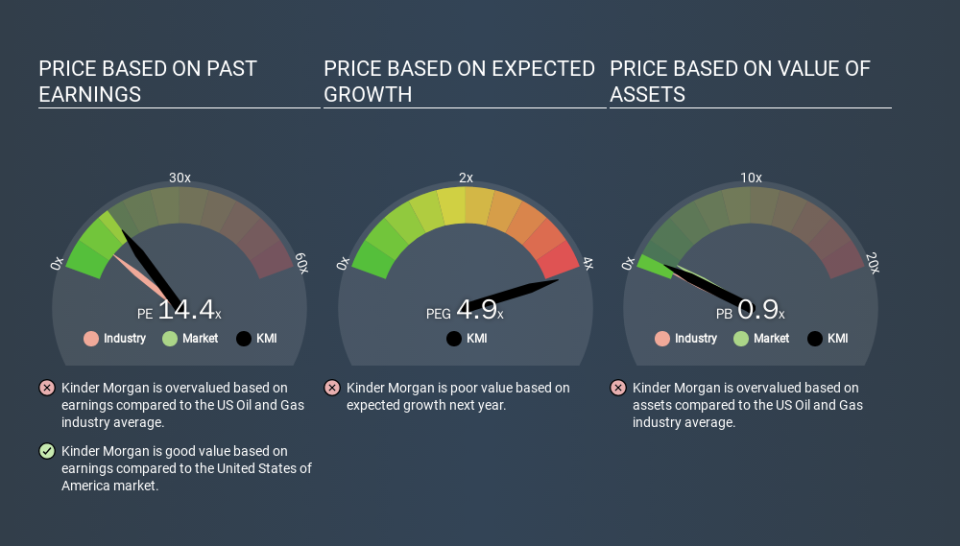
That means that the market expects Kinder Morgan will outperform other companies in its industry. Clearly the market expects growth, but it isn't guaranteed. So further research is always essential. I often monitor director buying and selling.
How Growth Rates Impact P/E Ratios
Probably the most important factor in determining what P/E a company trades on is the earnings growth. When earnings grow, the 'E' increases, over time. And in that case, the P/E ratio itself will drop rather quickly. A lower P/E should indicate the stock is cheap relative to others -- and that may attract buyers.
It's nice to see that Kinder Morgan grew EPS by a stonking 45% in the last year. And it has bolstered its earnings per share by 1.5% per year over the last five years. With that performance, I would expect it to have an above average P/E ratio.
Don't Forget: The P/E Does Not Account For Debt or Bank Deposits
Don't forget that the P/E ratio considers market capitalization. That means it doesn't take debt or cash into account. The exact same company would hypothetically deserve a higher P/E ratio if it had a strong balance sheet, than if it had a weak one with lots of debt, because a cashed up company can spend on growth.
Such expenditure might be good or bad, in the long term, but the point here is that the balance sheet is not reflected by this ratio.
Is Debt Impacting Kinder Morgan's P/E?
Kinder Morgan's net debt is considerable, at 106% of its market cap. If you want to compare its P/E ratio to other companies, you must keep in mind that these debt levels would usually warrant a relatively low P/E.
The Verdict On Kinder Morgan's P/E Ratio
Kinder Morgan's P/E is 14.4 which is above average (13.3) in its market. While its debt levels are rather high, at least its EPS is growing quickly. So it seems likely the market is overlooking the debt because of the fast earnings growth. What can be absolutely certain is that the market has become significantly less optimistic about Kinder Morgan over the last month, with the P/E ratio falling from 22.7 back then to 14.4 today. For those who prefer to invest with the flow of momentum, that might be a bad sign, but for a contrarian, it may signal opportunity.
Investors have an opportunity when market expectations about a stock are wrong. People often underestimate remarkable growth -- so investors can make money when fast growth is not fully appreciated. So this free visual report on analyst forecasts could hold the key to an excellent investment decision.
Of course, you might find a fantastic investment by looking at a few good candidates. So take a peek at this free list of companies with modest (or no) debt, trading on a P/E below 20.
If you spot an error that warrants correction, please contact the editor at editorial-team@simplywallst.com. This article by Simply Wall St is general in nature. It does not constitute a recommendation to buy or sell any stock, and does not take account of your objectives, or your financial situation. Simply Wall St has no position in the stocks mentioned.
We aim to bring you long-term focused research analysis driven by fundamental data. Note that our analysis may not factor in the latest price-sensitive company announcements or qualitative material. Thank you for reading.
