
 Yahoo Finance
 Is Knoll's (NYSE:KNL) 119% Share Price Increase Well Justified?
Unless you borrow money to invest, the potential losses are limited. But when you pick a company that is really flourishing, you can make more than 100%. For example, the Knoll, Inc. (NYSE:KNL) share price has soared 119% in the last year. Most would be very happy with that, especially in just one year! On top of that, the share price is up 46% in about a quarter. This could be related to the recent financial results, released recently - you can catch up on the most recent data by reading our company report. However, the stock hasn't done so well in the longer term, with the stock only up 28% in three years.
Check out our latest analysis for Knoll
To paraphrase Benjamin Graham: Over the short term the market is a voting machine, but over the long term it's a weighing machine. One flawed but reasonable way to assess how sentiment around a company has changed is to compare the earnings per share (EPS) with the share price.
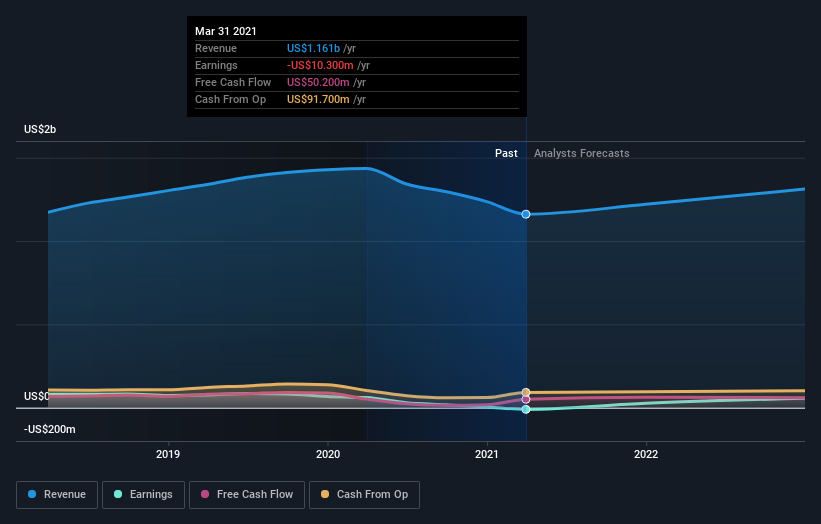
During the last year Knoll saw its earnings per share (EPS) drop below zero. While this may prove temporary, we'd consider it a negative, so we would not have expected to see the share price up. We might get a clue to explain the share price move by looking to other metrics.
We doubt the modest 0.9% dividend yield is doing much to support the share price. Knoll's revenue actually dropped 19% over last year. So using a snapshot of key business metrics doesn't give us a good picture of why the market is bidding up the stock.
You can see how earnings and revenue have changed over time in the image below (click on the chart to see the exact values).
You can see how its balance sheet has strengthened (or weakened) over time in this free interactive graphic.
What About Dividends?
It is important to consider the total shareholder return, as well as the share price return, for any given stock. Whereas the share price return only reflects the change in the share price, the TSR includes the value of dividends (assuming they were reinvested) and the benefit of any discounted capital raising or spin-off. So for companies that pay a generous dividend, the TSR is often a lot higher than the share price return. In the case of Knoll, it has a TSR of 122% for the last year. That exceeds its share price return that we previously mentioned. And there's no prize for guessing that the dividend payments largely explain the divergence!
A Different Perspective
We're pleased to report that Knoll shareholders have received a total shareholder return of 122% over one year. And that does include the dividend. That gain is better than the annual TSR over five years, which is 3%. Therefore it seems like sentiment around the company has been positive lately. Someone with an optimistic perspective could view the recent improvement in TSR as indicating that the business itself is getting better with time. It's always interesting to track share price performance over the longer term. But to understand Knoll better, we need to consider many other factors. For instance, we've identified 2 warning signs for Knoll (1 can't be ignored) that you should be aware of.
If you would prefer to check out another company -- one with potentially superior financials -- then do not miss this free list of companies that have proven they can grow earnings.
Please note, the market returns quoted in this article reflect the market weighted average returns of stocks that currently trade on US exchanges.
This article by Simply Wall St is general in nature. It does not constitute a recommendation to buy or sell any stock, and does not take account of your objectives, or your financial situation. We aim to bring you long-term focused analysis driven by fundamental data. Note that our analysis may not factor in the latest price-sensitive company announcements or qualitative material. Simply Wall St has no position in any stocks mentioned.
Have feedback on this article? Concerned about the content? Get in touch with us directly. Alternatively, email editorial-team (at) simplywallst.com.
