
 Yahoo Finance
 All You Need To Know About Allogene Therapeutics, Inc.’s (NASDAQ:ALLO) Financial Health

Small-caps and large-caps are wildly popular among investors; however, mid-cap stocks, such as Allogene Therapeutics, Inc. (NASDAQ:ALLO) with a market-capitalization of US$3.2b, rarely draw their attention. However, generally ignored mid-caps have historically delivered better risk adjusted returns than both of those groups. Today we will look at ALLO’s financial liquidity and debt levels, which are strong indicators for whether the company can weather economic downturns or fund strategic acquisitions for future growth. Note that this information is centred entirely on financial health and is a top-level understanding, so I encourage you to look further into ALLO here.
View our latest analysis for Allogene Therapeutics
Does ALLO Produce Much Cash Relative To Its Debt?
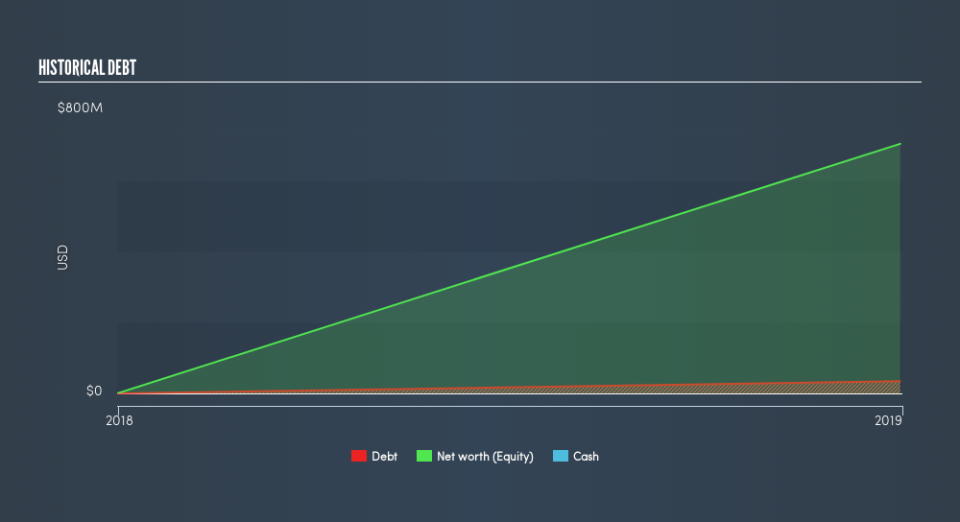
In the previous 12 months, ALLO’s rose by about US$34m including long-term debt. With this ramp up in debt, ALLO’s cash and short-term investments stands at US$459m , ready to be used for running the business. Moving on, operating cash flow was negative over the last twelve months. As the purpose of this article is a high-level overview, I won’t be looking at this today, but you can assess some of ALLO’s operating efficiency ratios such as ROA here.
Can ALLO meet its short-term obligations with the cash in hand?
At the current liabilities level of US$29m, it appears that the company has been able to meet these obligations given the level of current assets of US$468m, with a current ratio of 15.89x. The current ratio is the number you get when you divide current assets by current liabilities. Having said that, a ratio above 3x may be considered excessive by some investors.
Can ALLO service its debt comfortably?
ALLO’s level of debt is low relative to its total equity, at 4.9%. This range is considered safe as ALLO is not taking on too much debt obligation, which may be constraining for future growth. Risk around debt is extremely low for ALLO, and the company also has the ability and headroom to increase debt if needed going forward.
Next Steps:
ALLO’s cash flow coverage indicates it could improve its operating efficiency in order to meet demand for debt repayments should unforeseen events arise. However, the company exhibits an ability to meet its near term obligations should an adverse event occur. I admit this is a fairly basic analysis for ALLO’s financial health. Other important fundamentals need to be considered alongside. I suggest you continue to research Allogene Therapeutics to get a more holistic view of the stock by looking at:
Future Outlook: What are well-informed industry analysts predicting for ALLO’s future growth? Take a look at our free research report of analyst consensus for ALLO’s outlook.
Historical Performance: What has ALLO’s returns been like over the past? Go into more detail in the past track record analysis and take a look at the free visual representations of our analysis for more clarity.
Other High-Performing Stocks: Are there other stocks that provide better prospects with proven track records? Explore our free list of these great stocks here.
We aim to bring you long-term focused research analysis driven by fundamental data. Note that our analysis may not factor in the latest price-sensitive company announcements or qualitative material.
If you spot an error that warrants correction, please contact the editor at editorial-team@simplywallst.com. This article by Simply Wall St is general in nature. It does not constitute a recommendation to buy or sell any stock, and does not take account of your objectives, or your financial situation. Simply Wall St has no position in the stocks mentioned. Thank you for reading.
